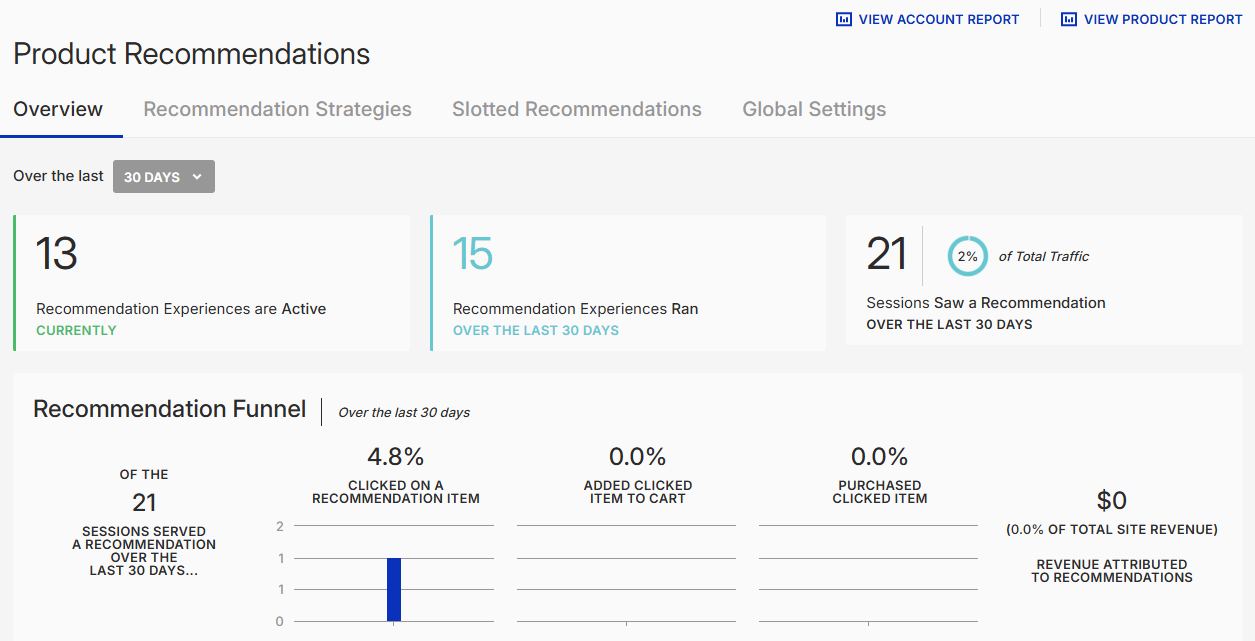
The dashboard on the Overview tab of the Product Recommendations page offers you a quick look at the recommendations running across your site. These widgets allow you to understand how many recommendations are running across your site, how customers are interacting with them, and how those interactions translate into conversions and revenue.
Access the dashboard by selecting Product Recommendations from Components in the left-hand navigation.

The default lookback period for the dashboard is 30 days. You can change it by selecting a different option from Over the last.

Available Data
The three widgets in the top row of the dashboard display the following information.
- Recommendation Experiences are Active CURRENTLY — The number of recommendation experiences running on your site
- Recommendation Experiences Ran OVER THE LAST [no.] DAYS — The total recommendation experiences with at least one recommendation action that ran over the number of days as determined by the option selected from Over the last
- Sessions Saw a Recommendation OVER THE LAST [no.] DAYS — The total sessions in which a recommendations action fired on the page
Recommendation Funnel
The Recommendation Funnel contains the following information for the selected lookback period:
- OF THE [no.] SESSIONS SERVED A RECOMMENDATION OVER THE LAST [no.] DAYS — The total sessions in which a recommendations action fired on the page
- CLICKED ON A RECOMMENDATION ITEM — A percentage of and graph charting the total sessions that have at least one recommendation click
- ADDED CLICKED ITEM TO CART — A percentage of and graph charting the total sessions in which a clicked recommended item was added to the cart
- PURCHASED CLICKED ITEM— A percentage of and graph charting the total sessions in which a clicked recommended item was purchased
- REVENUE ATTRIBUTED TO RECOMMENDATIONS — The total revenue from products in a recommendation that were clicked and then purchased