The analytics for Dynamic Testing experiences focus on the performance of the goal metric and the current chance to win.
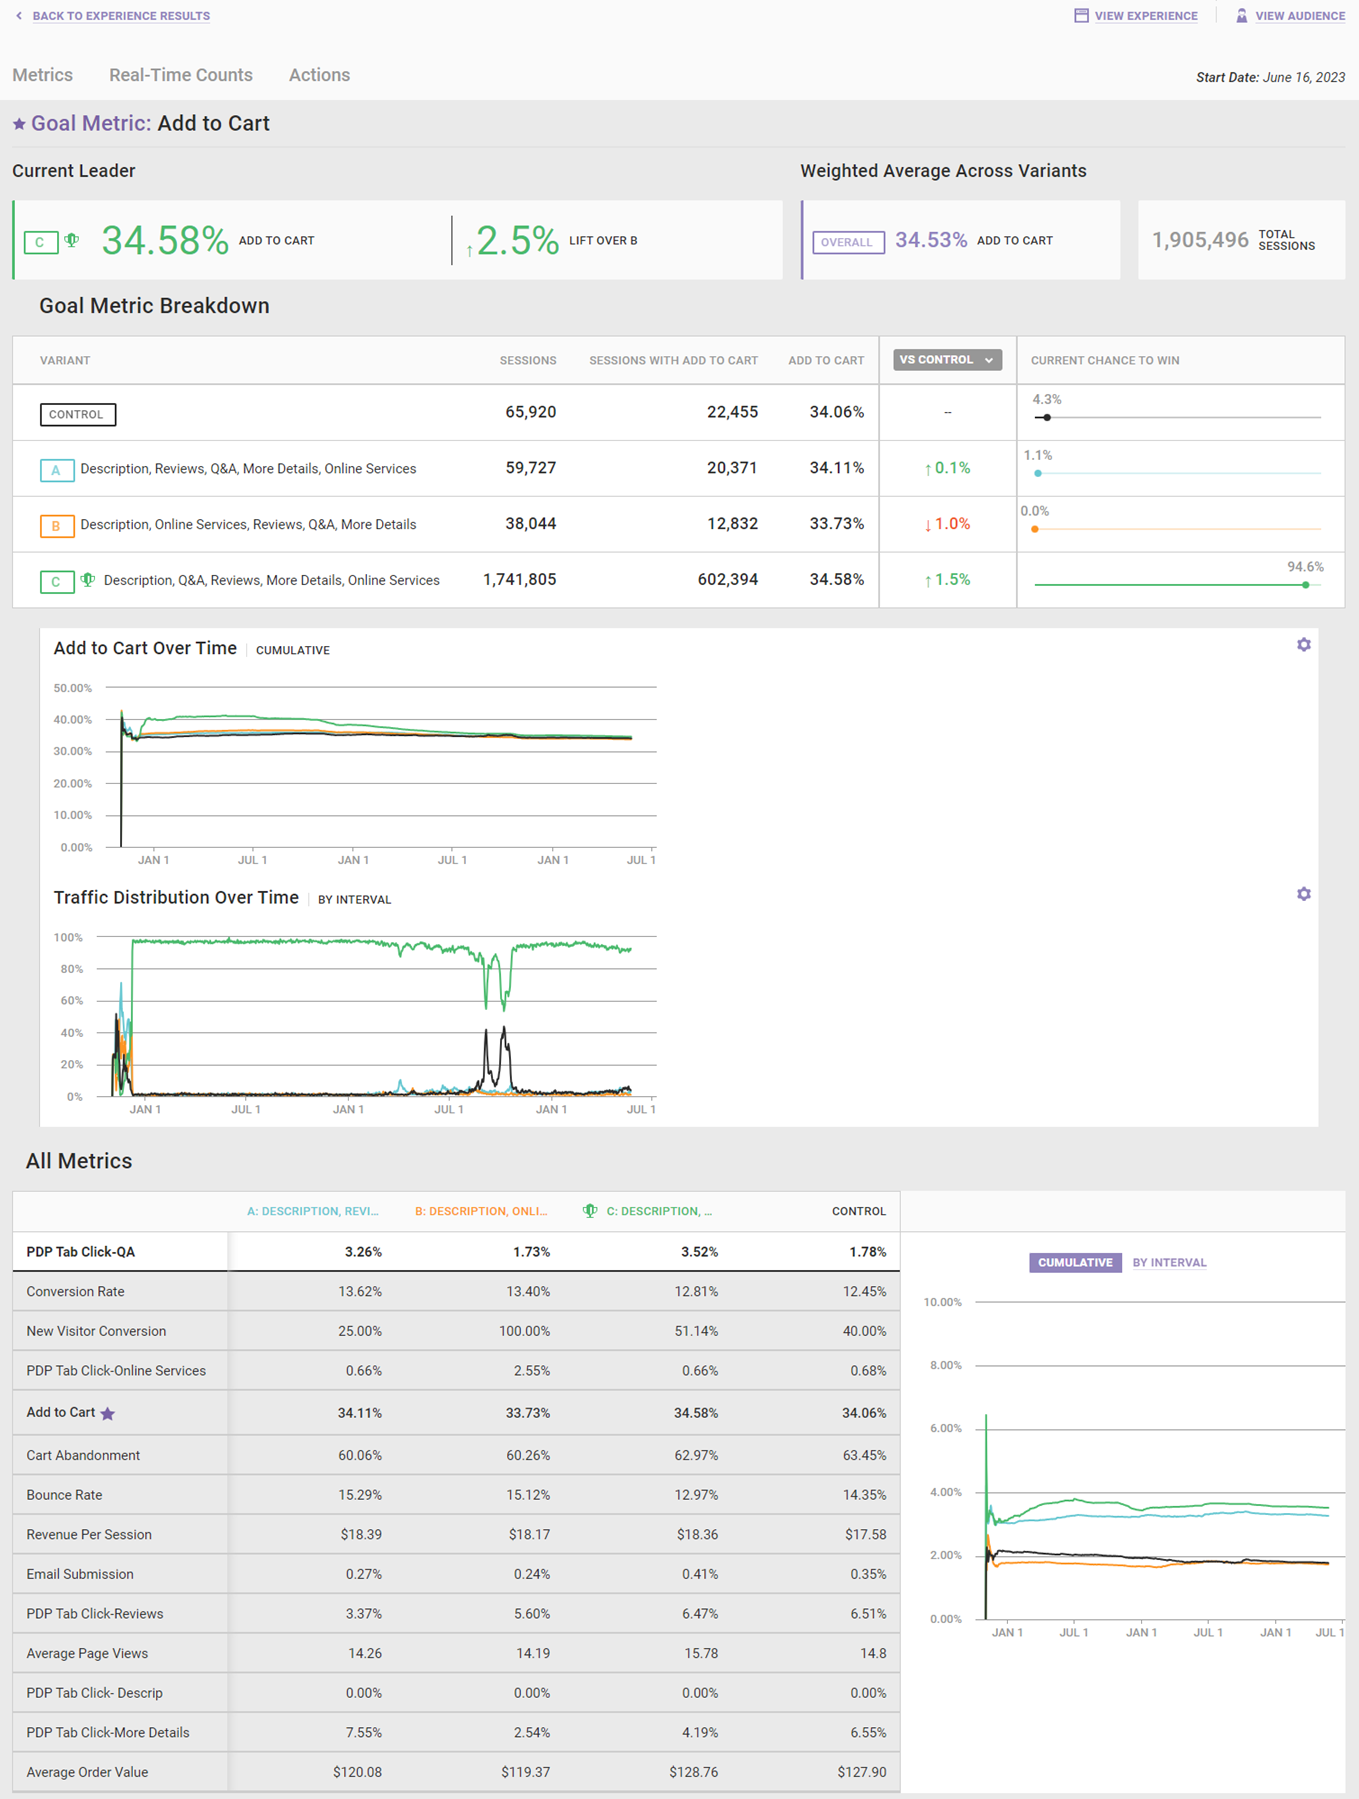
Dynamic Testing experience results are available as soon as sessions included in the experience end, which occurs after customers are inactive for at least 30 minutes. Updates are available after every minute by refreshing the page.
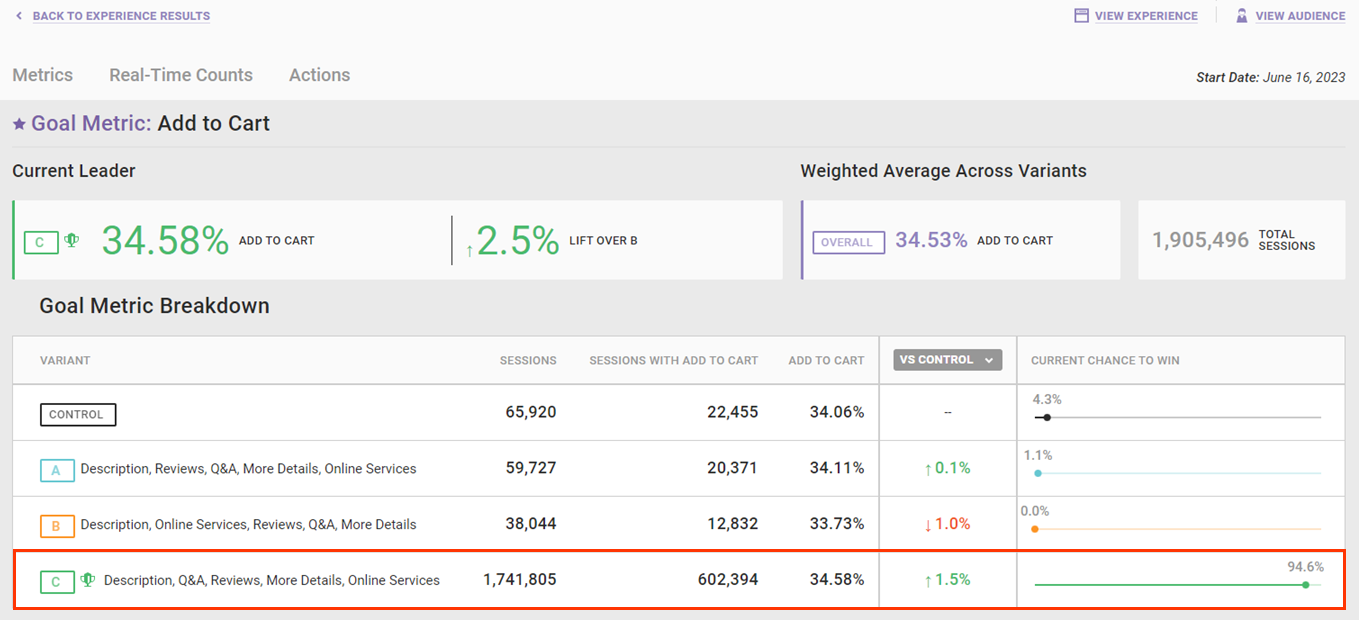
Goal Metric Breakdown
When you activate a Dynamic Testing experience, Monetate measures performance of the goal metric across all variants. When it determines that one variant is outperforming another, it adjusts the traffic distribution of the variants based on the cumulative goal performance. In the screenshot below, variant B has a 100% current chance to win.
The Experience Results page displays goal performance for the current leader as well as the weighted average across variants in the Dynamic Testing experience. For Dynamic Testing experiences running for an extended time, the overall goal performance provides insight into how all variants have contributed to the goal if the leading variant has changed throughout the test.
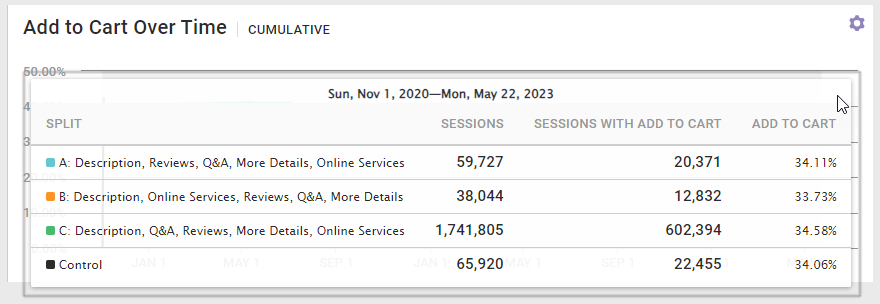
The Goal Performance Over Time and Traffic Distribution Over Time widgets show how Monetate updated traffic throughout the test as well as the resulting impact on the goal metric over time. In this screenshot, you can see the Add to Cart Over Time chart change to reflect the goal metric for the experience.
![Example of a '[Goal metric] Performance Over Time' chart on the Metrics tab of the Experience Results page for a Dynamic Testing experience](https://dyzz9obi78pm5.cloudfront.net/app/image/id/648cc6d4299c555fd41fa0c2/n/analytics-experience-results-dynamic-testing-metrics-add-to-cart-over-time.png)
For each widget you can toggle between a cumulative view and an interval view of the data presented. Click the settings cog for the widget, and then select the view you want.
![Callout of the settings cog and VIEW DATA AS options for the '[Goal metric] Performance Over Time' chart on the Metrics tab of the Experience Results page for a Dynamic Testing experience](https://dyzz9obi78pm5.cloudfront.net/app/image/id/648cc779efd5e6637a794325/n/analytics-experience-results-dynamic-testing-metrics-add-to-cart-over-time-settings.png)
Place your mouse pointer on any section of either graph to view specific information about the performance of the variants. This screenshot shows the cumulative data view from the time the experience started to a specific point for the goal metric's performance over time.
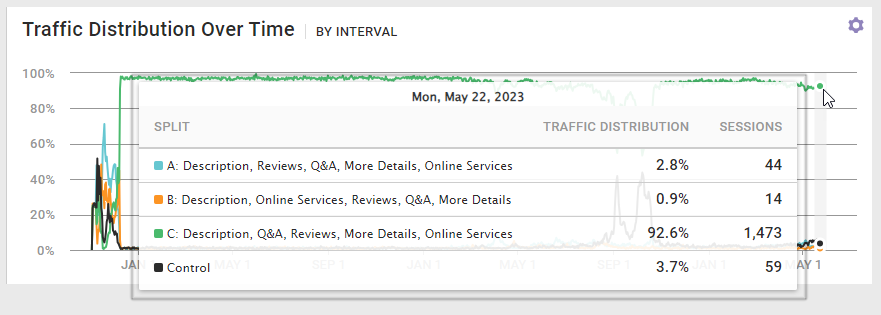
This screenshot shows the traffic distribution interval view for a specific date.
Performance of All Metrics
The All Metrics widget shows the performance of each metric included in the experience for each variant in the test. Click a metric on the left-hand side of the widget to see its performance charted.
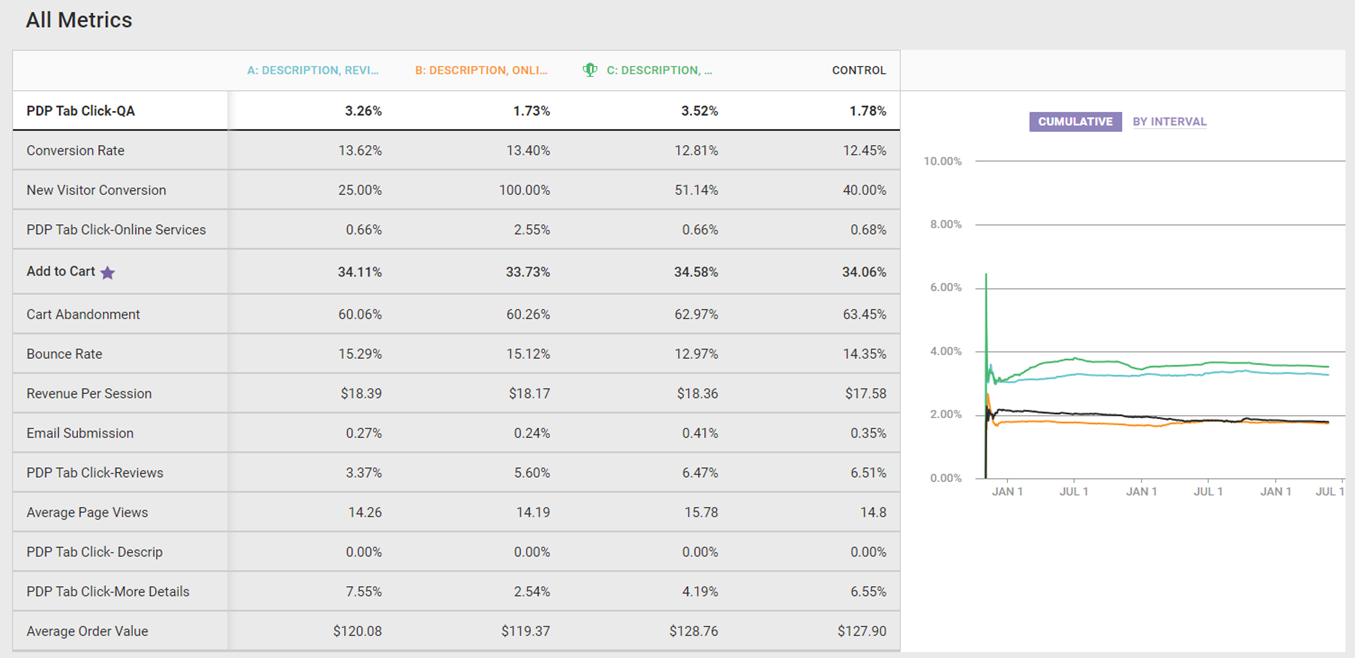
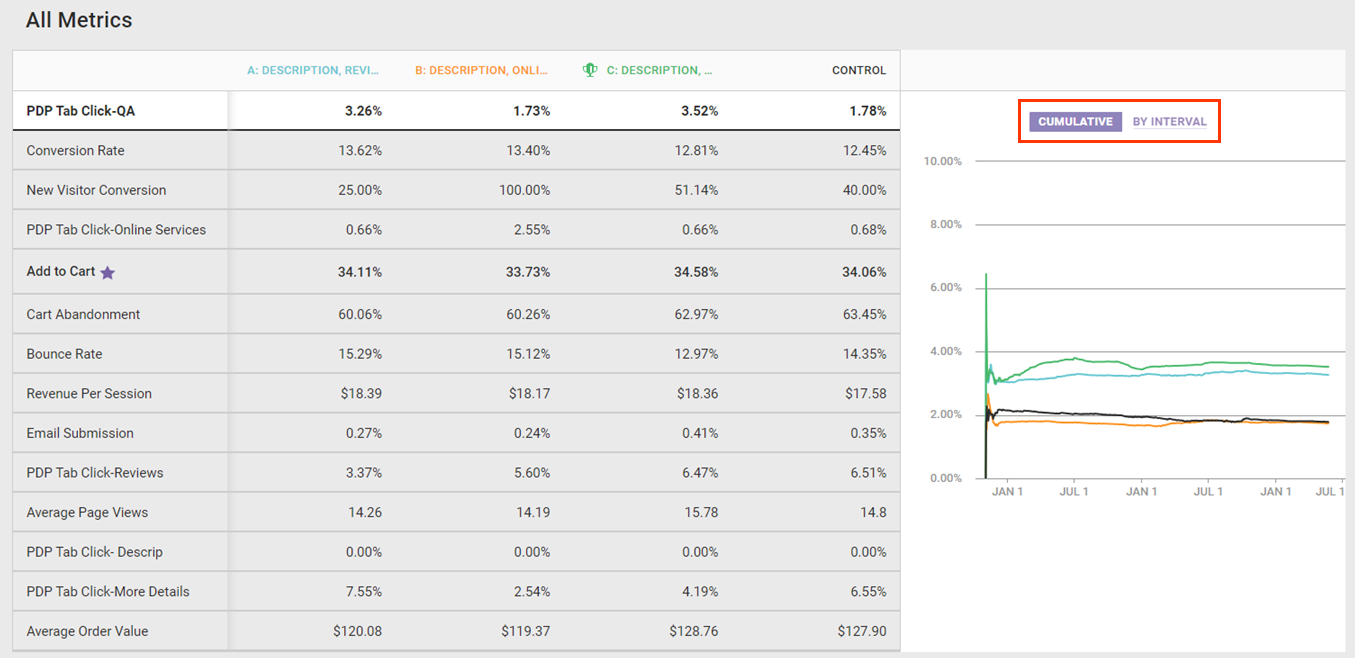
You can toggle between a cumulative view and an interval view of the metric performance charted on the right-hand side of the widget.
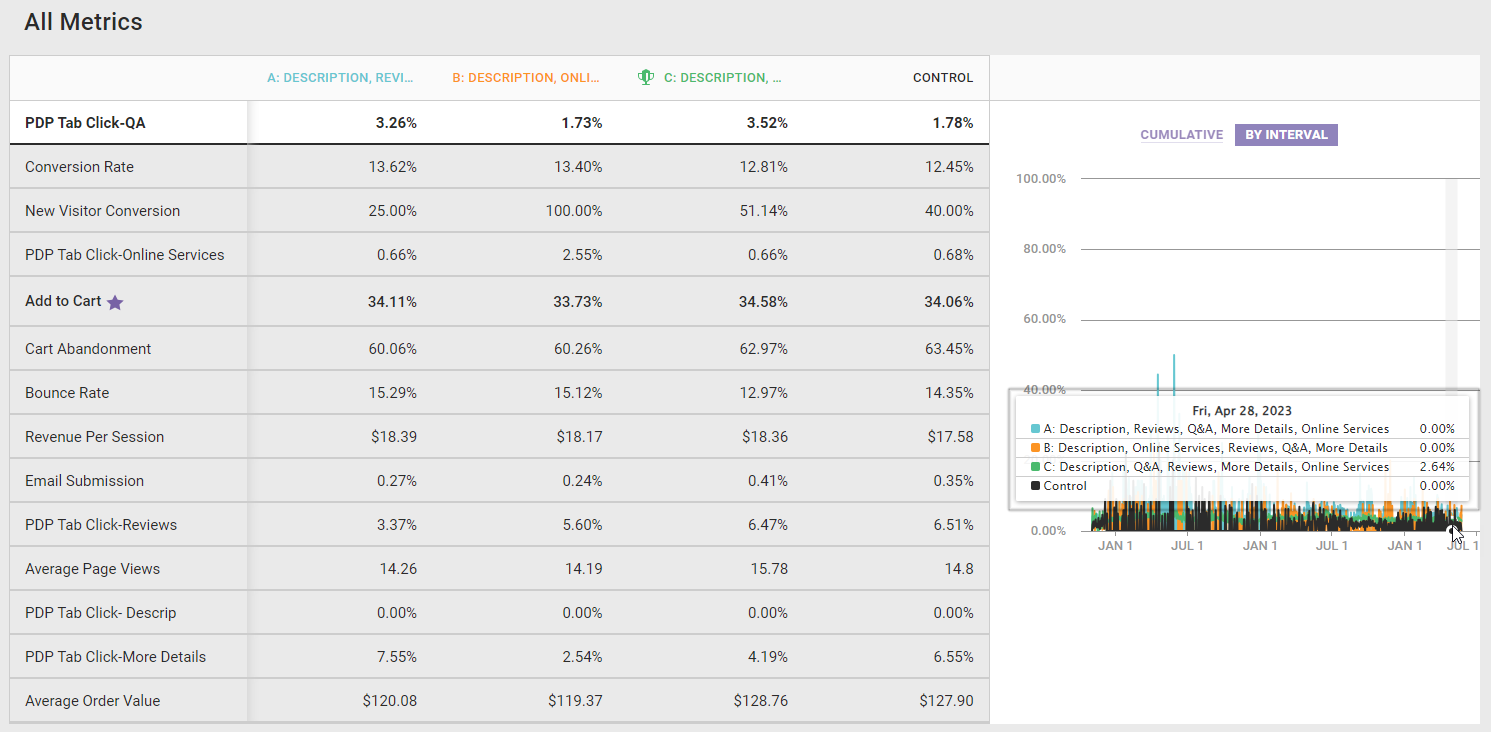
As with the Goal Performance Over Time and Traffic Distribution Over Time widgets, place your mouse pointer on any point on the graph to view its data breakdown.
The All Metrics widget provides you with insight into how the current leader impacts each tracked metric in the experience. With that information in mind, you shouldn't use the performance of any metric that isn't the goal metric to inform business decisions because Monetate reallocates traffic based on how the goal metric performs and doesn't pay attention to the performance of any other metric when doing so.