Exporting experience results allows you to save the raw data for an experience (by day) to your computer for further analysis. You can download the raw data from an experience's results as a comma-separated values (CSV) file or display it as an HTML table in your browser.
Downloading the CSV File
Follow these steps to download the raw data from an experience's results as a CSV file.
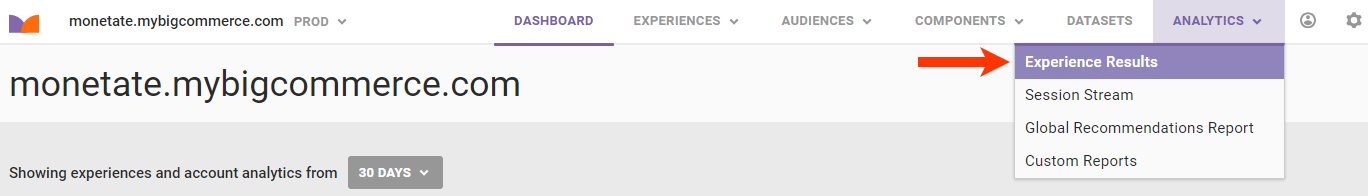
- Click ANALYTICS in the top navigation bar, and then select Experience Results.
- Search for the experience's entry on the Experience Analytics list page.
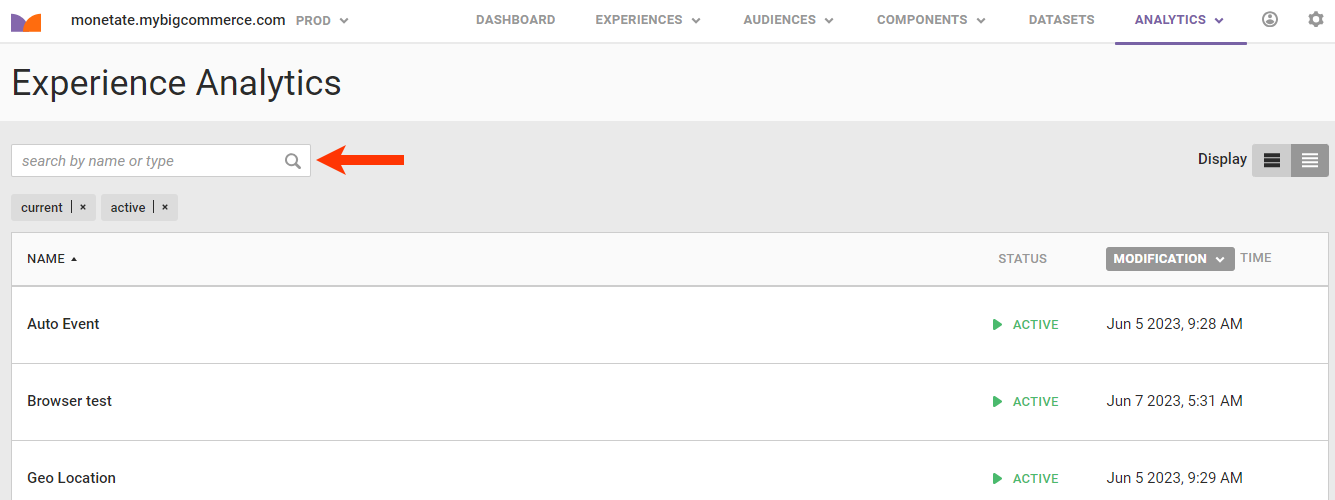
- Click the experience's name to open its Experience Results page.
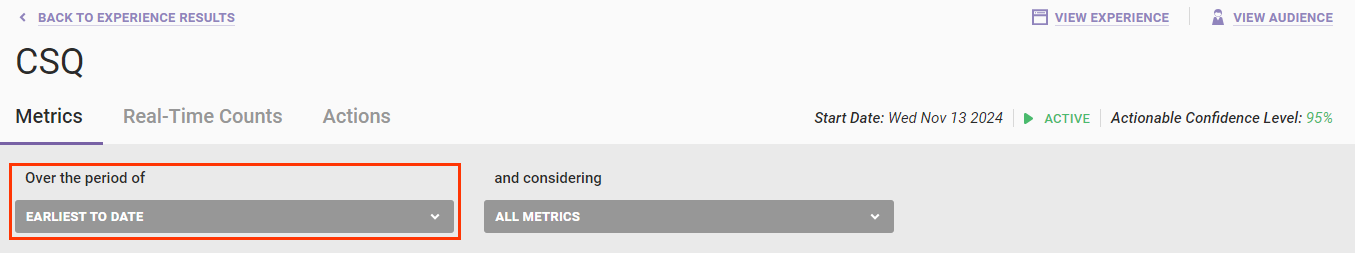
- If necessary, adjust the lookback period by selecting an option from Over the period of.
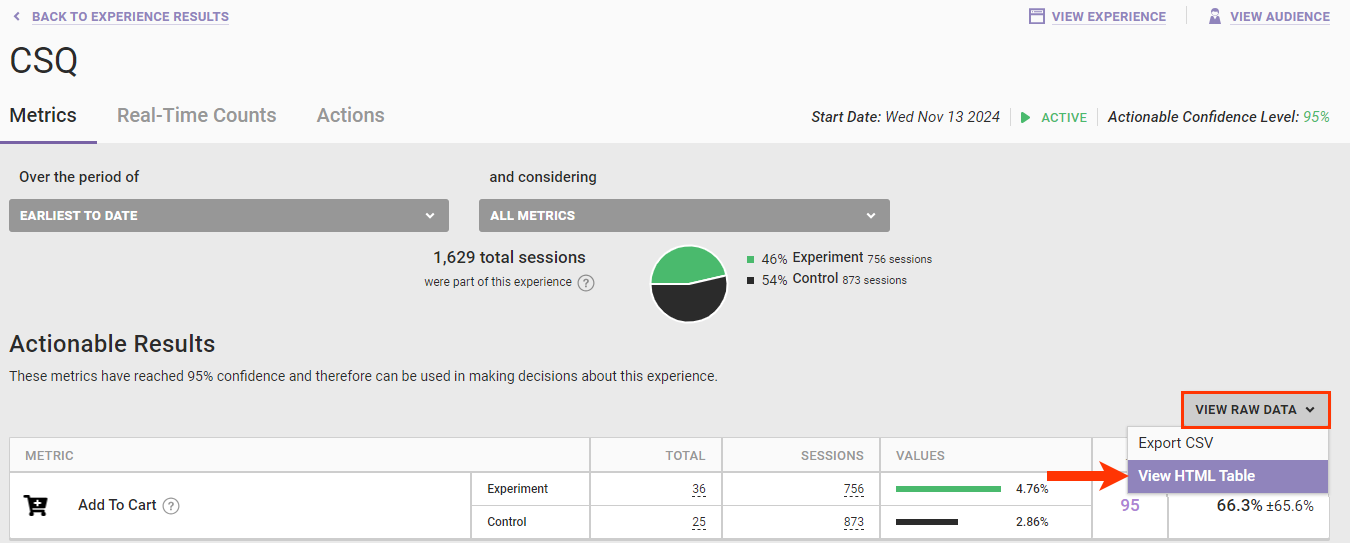
- Click VIEW RAW DATA and then select Export CSV.
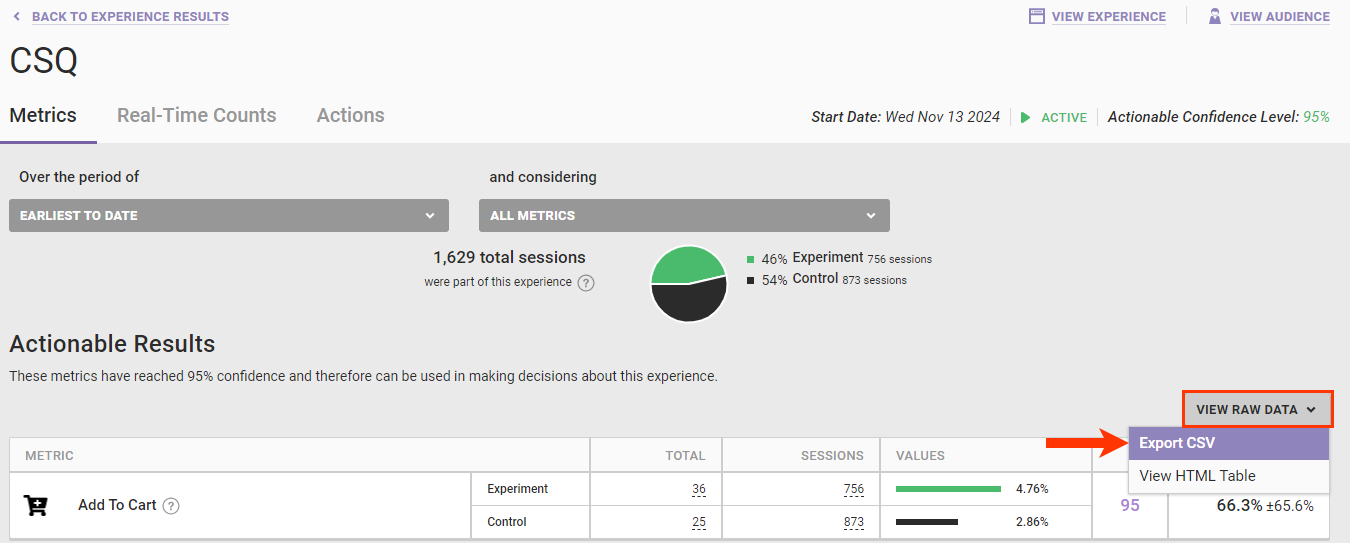
The CSV file downloads to the default file download location that you have set in your browser settings.
Viewing the HTML Table
Follow these steps to view the raw data from an experience's results as an HTML table.
- Click ANALYTICS in the top navigation bar, and then select Experience Results.
- Search for the experience's entry on the Experience Analytics list page.
- Click the experience's name to open its Experience Results page.
- If necessary, adjust the lookback period by selecting an option from Over the period of.
- Click VIEW RAW DATA and then select View HTML table.
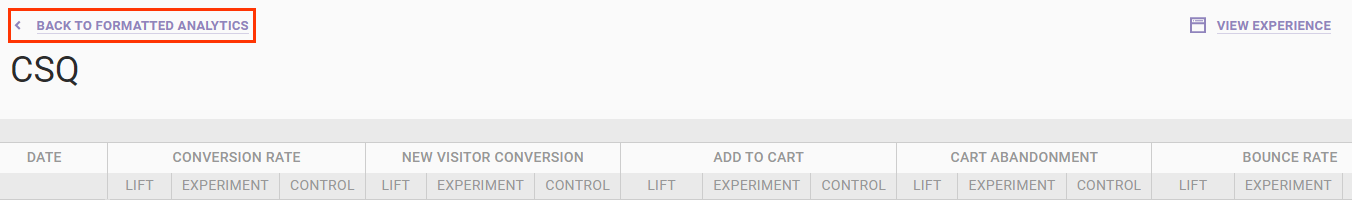
The HTML table opens in the same browser tab in which you open Monetate. Click BACK TO FORMATTED ANALYTICS to return to the Experience Results page.
Understanding Totals and Raw Totals
You may notice a substantial difference between the Totals and Raw Totals metrics in exported data. Totals refers to the number of unique users who interacted at least once with an event on your page, and Raw Totals refers to the total number of interactions with an event on your page.
For example, if a site visitor clicks the same button on your site 12 times during the same session, here's how that data is reported:
- Button Click Total: 1
- Button Click Raw Total: 12