To access Audience Discovery, click AUDIENCES in the top navigation bar, and then select Audience Discovery.

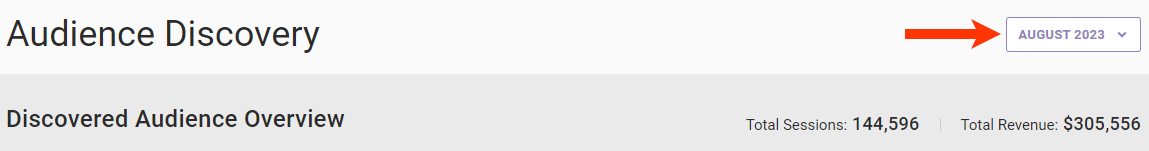
Data is gathered month by month to generate up to eight audiences. You can access one of the monthly containers from the selector at the top of the Audience Discovery page.
The Audience Discovery page contains two panes: Discovered Audience Overview and Audience Metrics.
Discovered Audience Overview
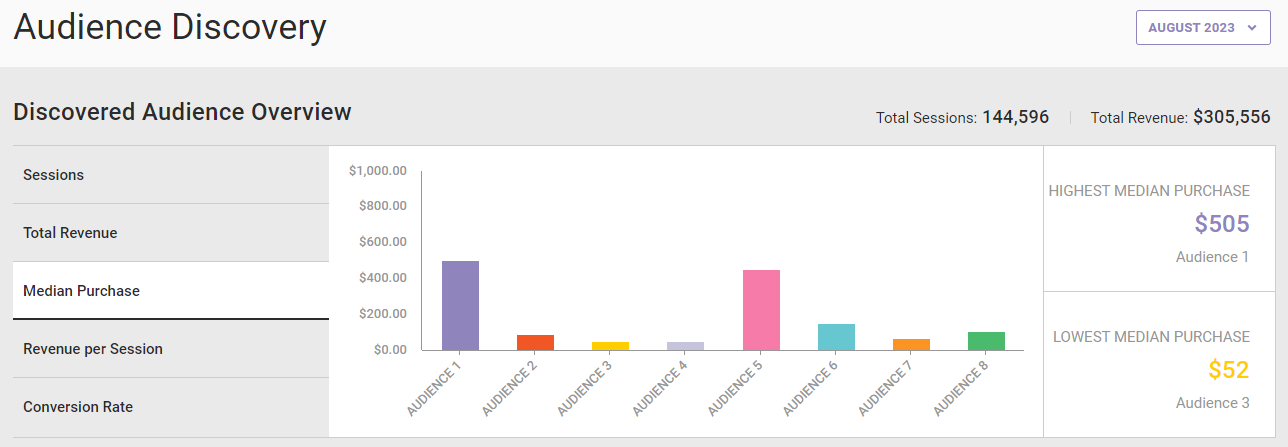
The top pane of the Audience Discovery page, Discovered Audience Overview, shows how each discovered audience performs across important Web metrics: sessions, total revenue, median purchase, revenue per session, and conversion rate. The total sessions and total revenue always appear at the top of the pane.
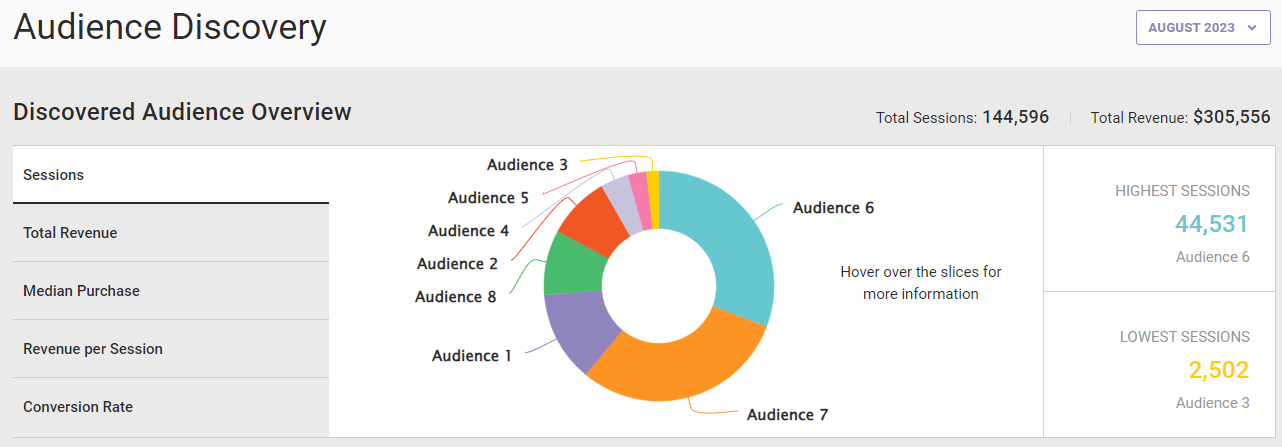
Click a metric in the left-hand list to view its audience breakdown.
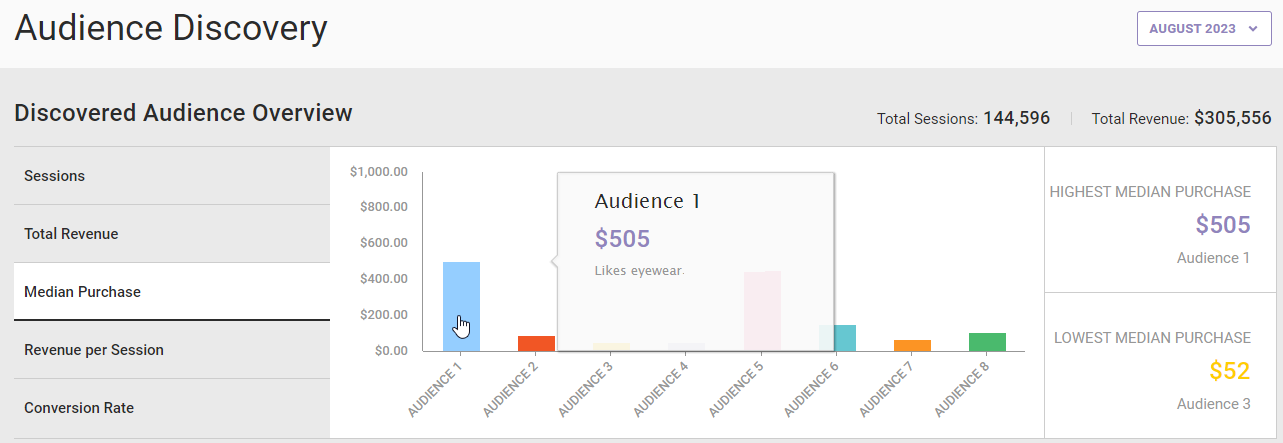
Place your mouse pointer on the segment of the chart for one audience, and a popup appears with more specific information about that segment.
You can find a more thorough breakdown of each audience's data in the Audience Metrics pane.
Audience Metrics
The bottom pane of the Audience Discovery page, Audience Metrics, provides a fuller summary of who those audiences are and how they engage.
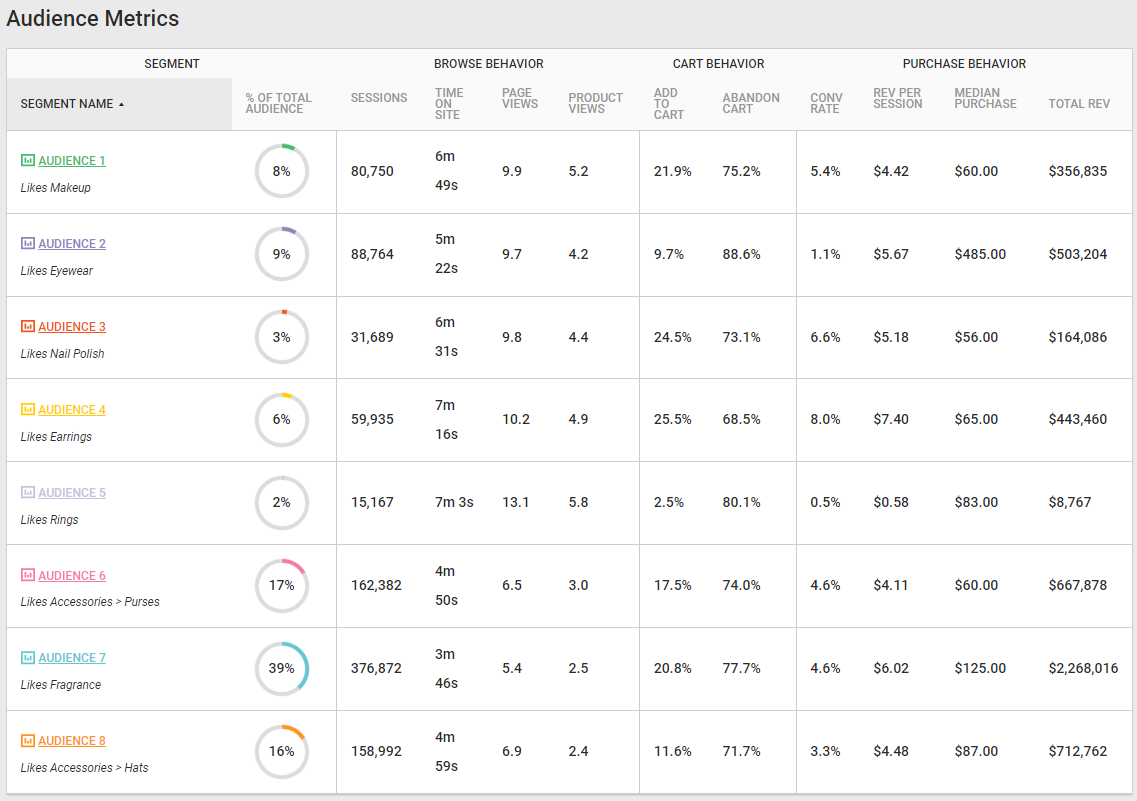
You can sort the Audience Metrics table by clicking any column header. Click that header a second time to change the sort order from greatest to least.
Click an audience name to view more detailed information about it on a new page.
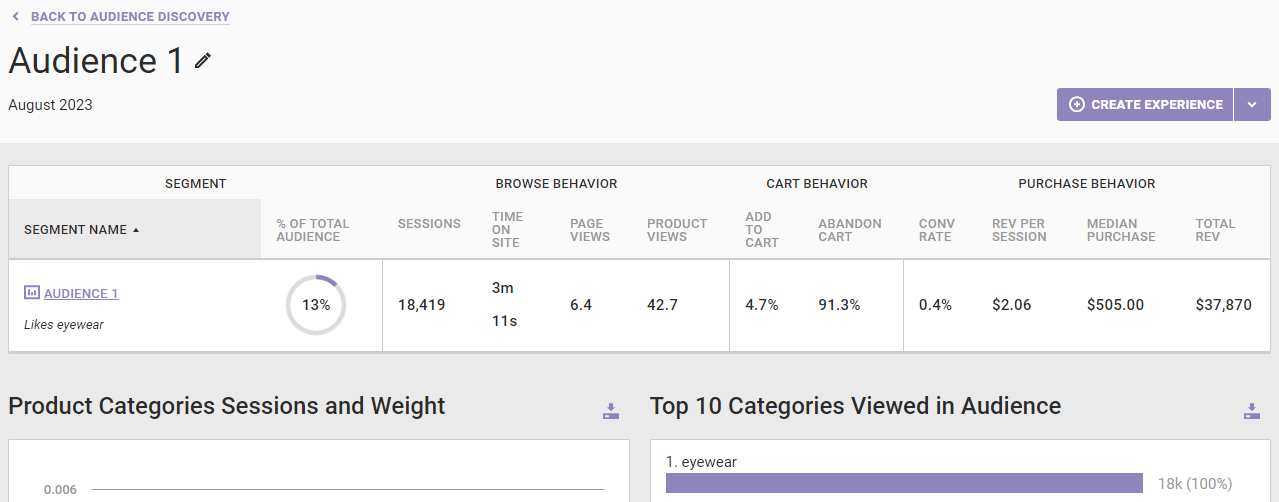
See Audience Details Page for more information.
Interpreting the Data
The goal of Audience Discovery is to segment customers according to the product categories in which they're interested. Marketers have a few different tools to help them better understand the type of customer that a discovered audience represents.
The Audience Metrics table can help you understand the ways these customers behave and shop. Because you can sort the table by metric, you can more easily compare the discovered audiences.
In this screenshot the Audience Metrics table has been sorted by Conversion rate.
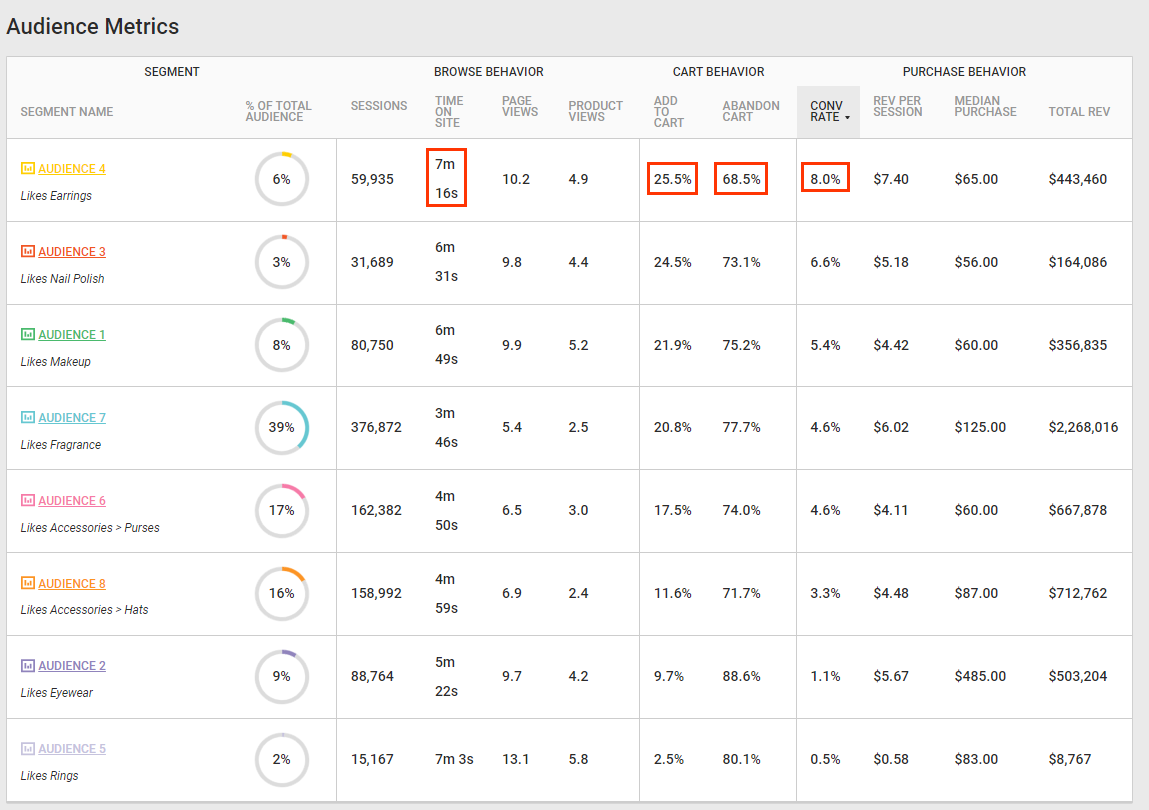
With the table sorted by the Conversion rate metric, you can see that Audience 4 has the highest rate compared to other the audiences even though it wasn't the largest audience in terms of sessions. This audience also has the longest Time on site, highest Add to cart rate, as well as the lowest Cart abandonment rate.
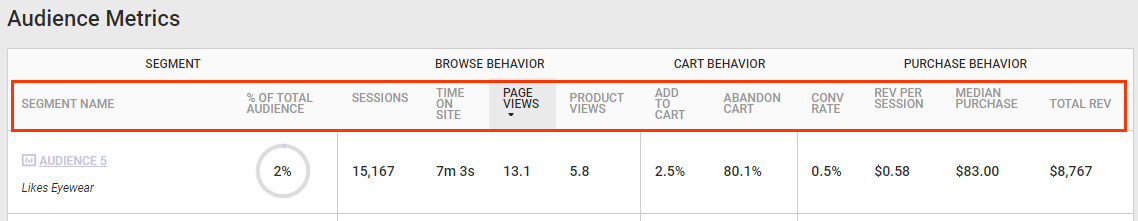
In this screenshot the Audience Metrics table has been sorted by page views. To better enable you to compare Audience 5 and Audience 7, the rows for the other audiences have been made opaque.
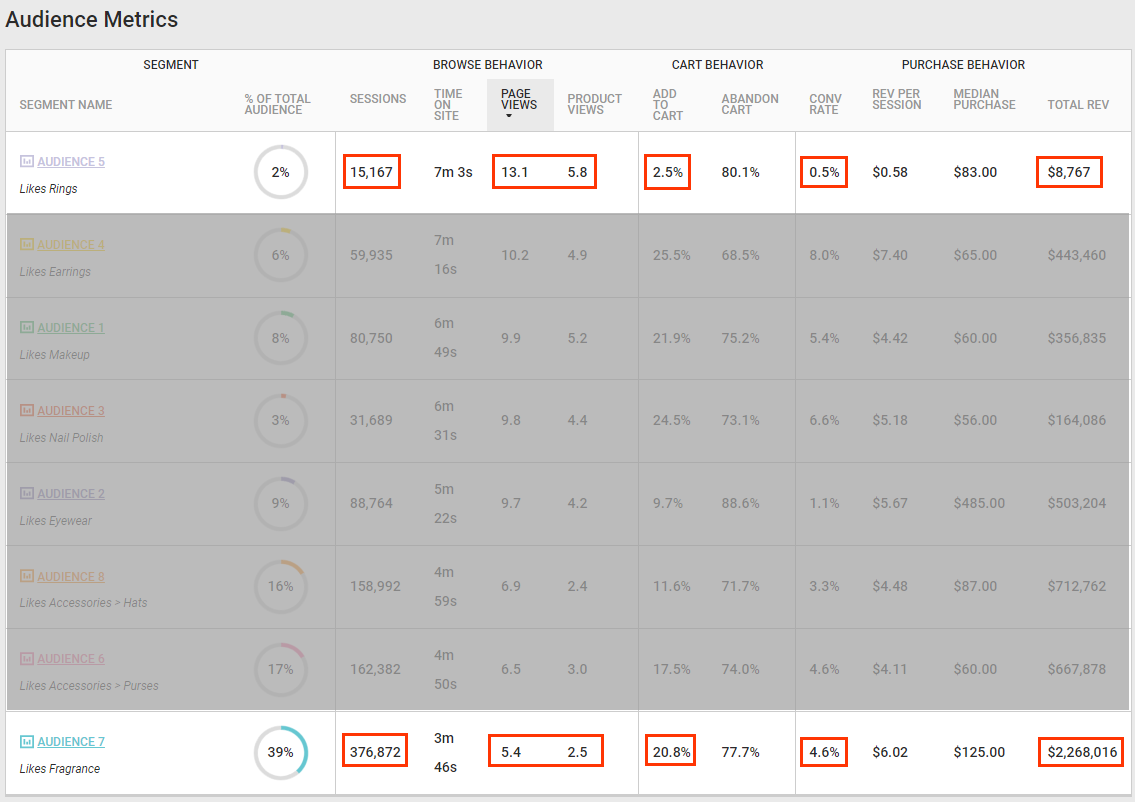
Although Audience 5 has a higher number of product and page views than Audience 7, it has fewer sessions, a much lower conversion rate, and significantly lower revenue than Audience 7. It also has a lower Add to cart rate, perhaps signifying that customers in that audience are browsing more frequently or simply seeking product information.