Custom Metrics in Experience Analytics

Follow these steps to view the analytics for a custom metric that you added to a Web experience.

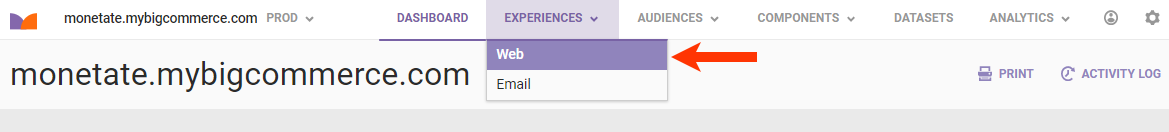
  1. Click EXPERIENCES in the top navigation bar and then select Web.

    Callout of the Web option in the EXPERIENCES menu of the top navigation bar

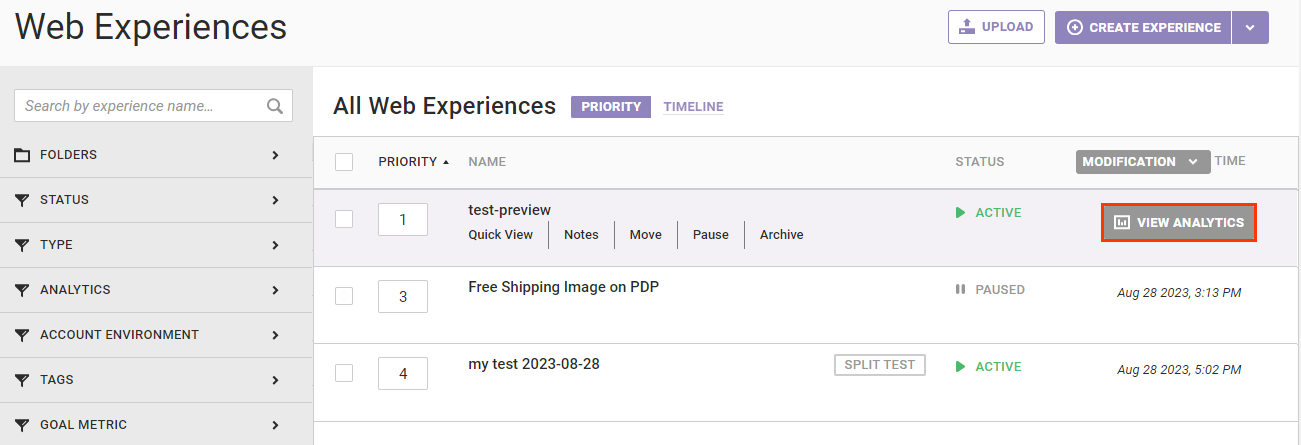
  2. Search for or scroll to find the experience that includes the custom metric.
  3. Place your mouse pointer on the entry for the experience, and then click VIEW ANALYTICS.

    Callout of the VIEW ANALYTICS button that appears for an entry on the Experiences list page

If the custom metric has reached confidence, it appears in the Actionable Results table on the Metrics tab of the experience results.
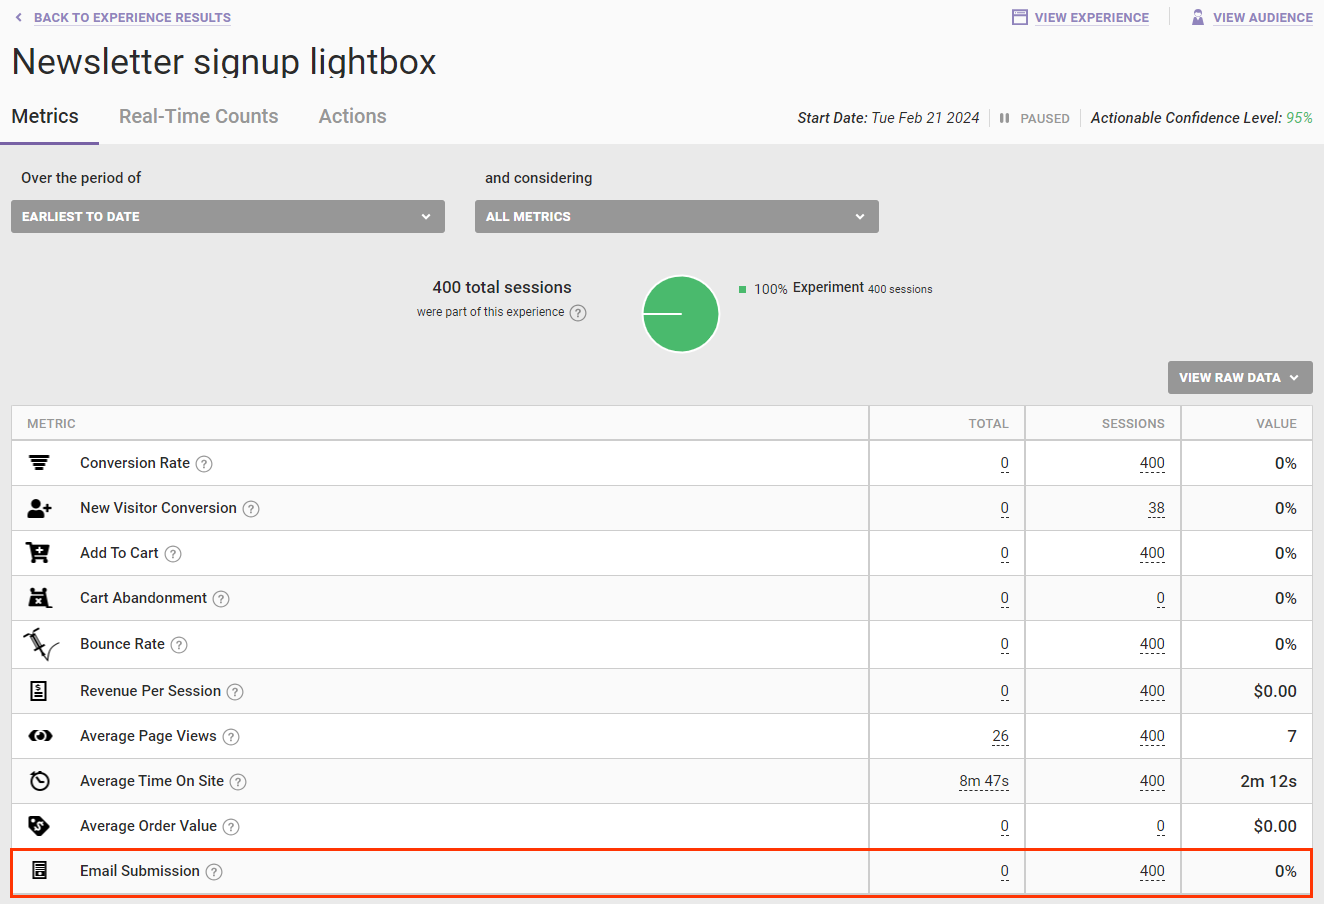
Callout of a custom metric in the Actionable Results table on the Metrics tab of the Experience Results page

If it hasn't, then it appears in the Pending table.

Callout of a custom metric in the Pending table on the Metrics tab of the Experience Results page

Regardless of which table it appears in, you can click the custom metric to view various data and charts of its performance over time.

An event is tracked if it occurred at least once during a user's session. Therefore, in the experience results the number of page events recorded represents the number of sessions during which the event occurred and not the total number of times the event occurred.

Select an option from Over the period of to change the date range for the results graphed. While the default chart view is the cumulative average over time of how the metric has performed, you can click Daily above the graph to view the daily values.

Example of a custom metric's results with callouts of the Over the period of selector and the Cumulative and Daily view toggle

See Export Experience Results Data if you want to export the experience results for all metrics. You can download the raw data from an experience's results as a comma-separated values (CSV) file or display it as an HTML table in your browser.

You may notice a substantial difference between the Totals and Raw Totals datapoints in exported data. The reason is that Totals is to the number of unique visitors who interacted at least once with the event on your page that is tracked for the custom metric, and Raw Totals is the total number of interactions with that event.

For example, if a visitor clicks the same button on your site 12 times during the same session, the reported data would be as follows:

  • Button Click Totals: 1
  • Button Click Raw Totals: 12