Follow these steps to view the analytics for a custom metric that you added to a Web experience.
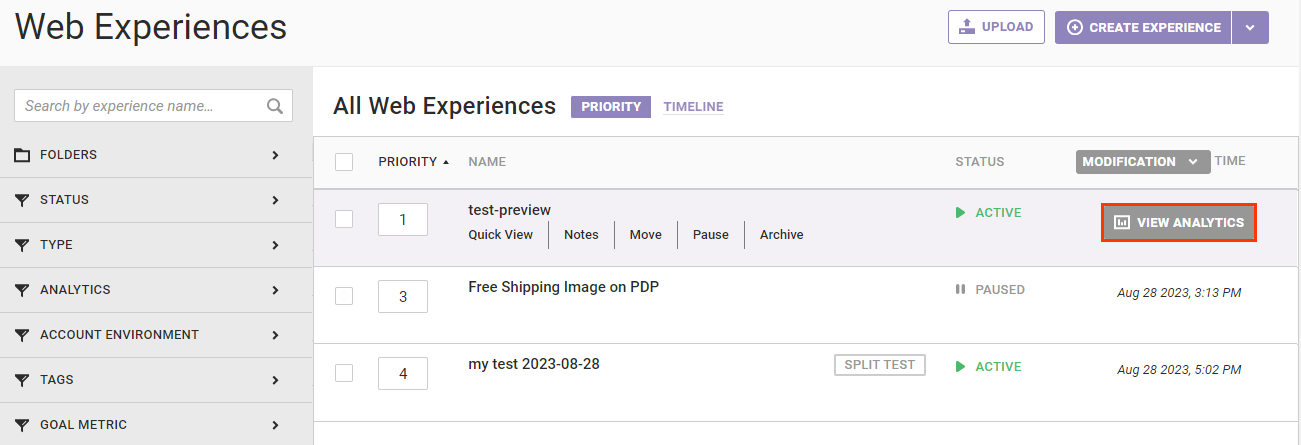
- Click EXPERIENCES in the top navigation bar and then select Web.

- Search for or scroll to find the experience that includes the custom metric.
- Place your mouse pointer on the entry for the experience, and then click VIEW ANALYTICS.

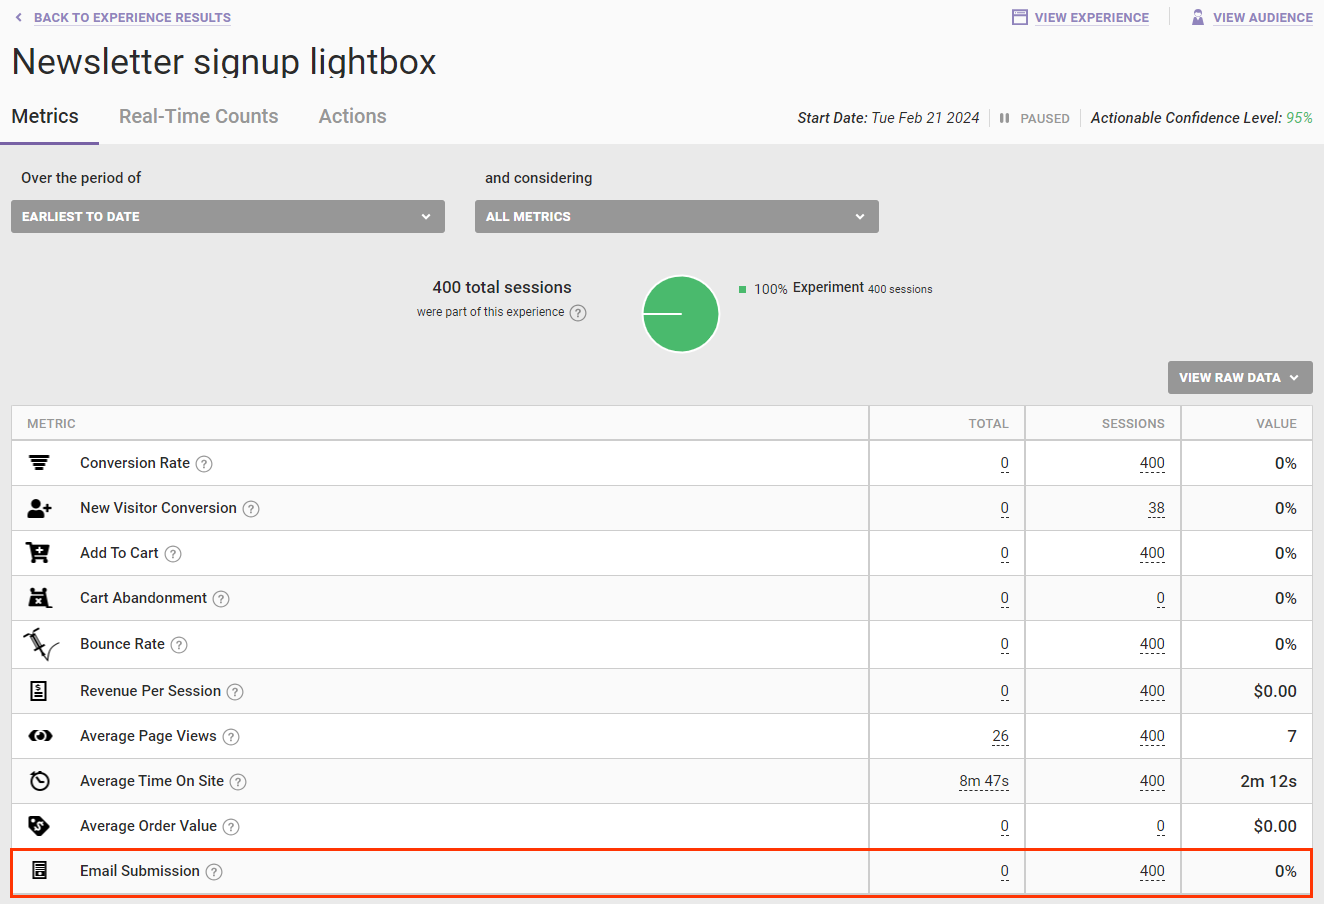
Custom metrics appear after the default system metrics in the table on the Metrics tab of the experience results.

Click a custom metric to view various data and charts of its performance over time.
See the documentation in the Experience Results category for more information about the results data that you can view about a custom metric included in an experience.