The Real-Time Counts tab of the Experience Results page displays experience data as it rolls in so that you can better understand whether or not the experience is configured properly and better determine if the right customers are seeing the experience without waiting a full 24 hours for results.
Accessing an Experience's Real-Time Counts
Follow these steps to access the real-time counts for an experience.
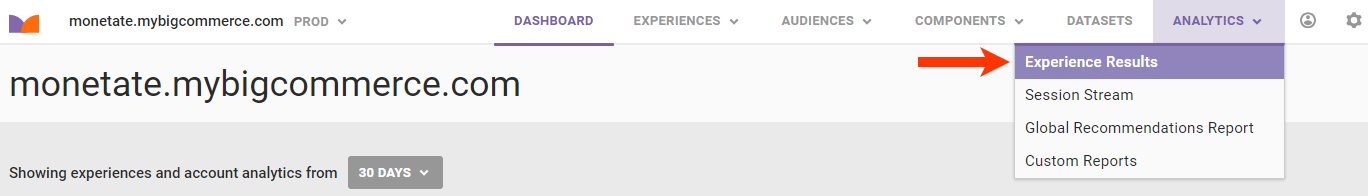
- Click ANALYTICS in the top navigation bar, and then select Experience Results.
- Search for the experience's entry on the Experience Analytics list page.
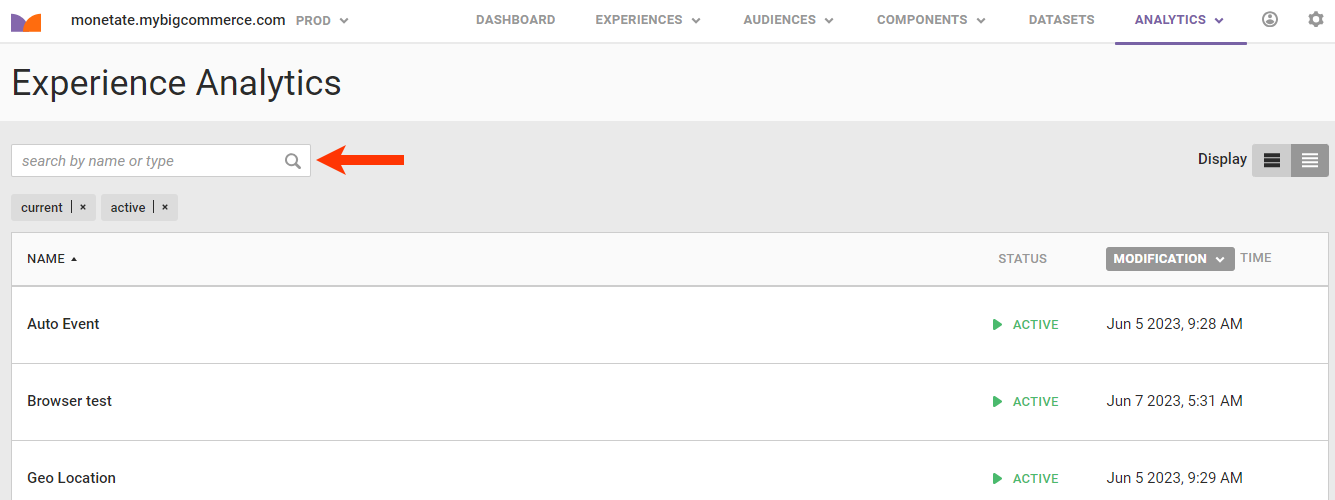
- Click the experience's name.
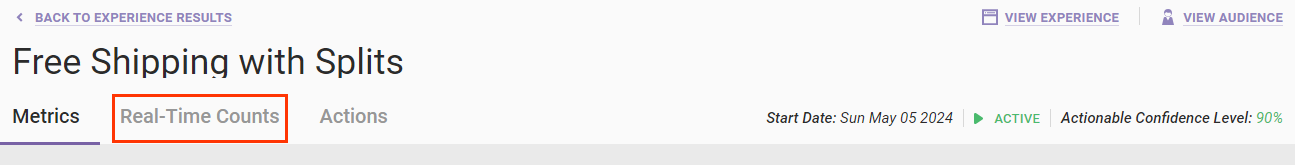
- If necessary, click Real-Time Counts.
Real-Time Counts Tab
Data for an experience is available immediately after you activate an experience on the Real-Time Counts tab. All data on this tab automatically refreshes every minute.
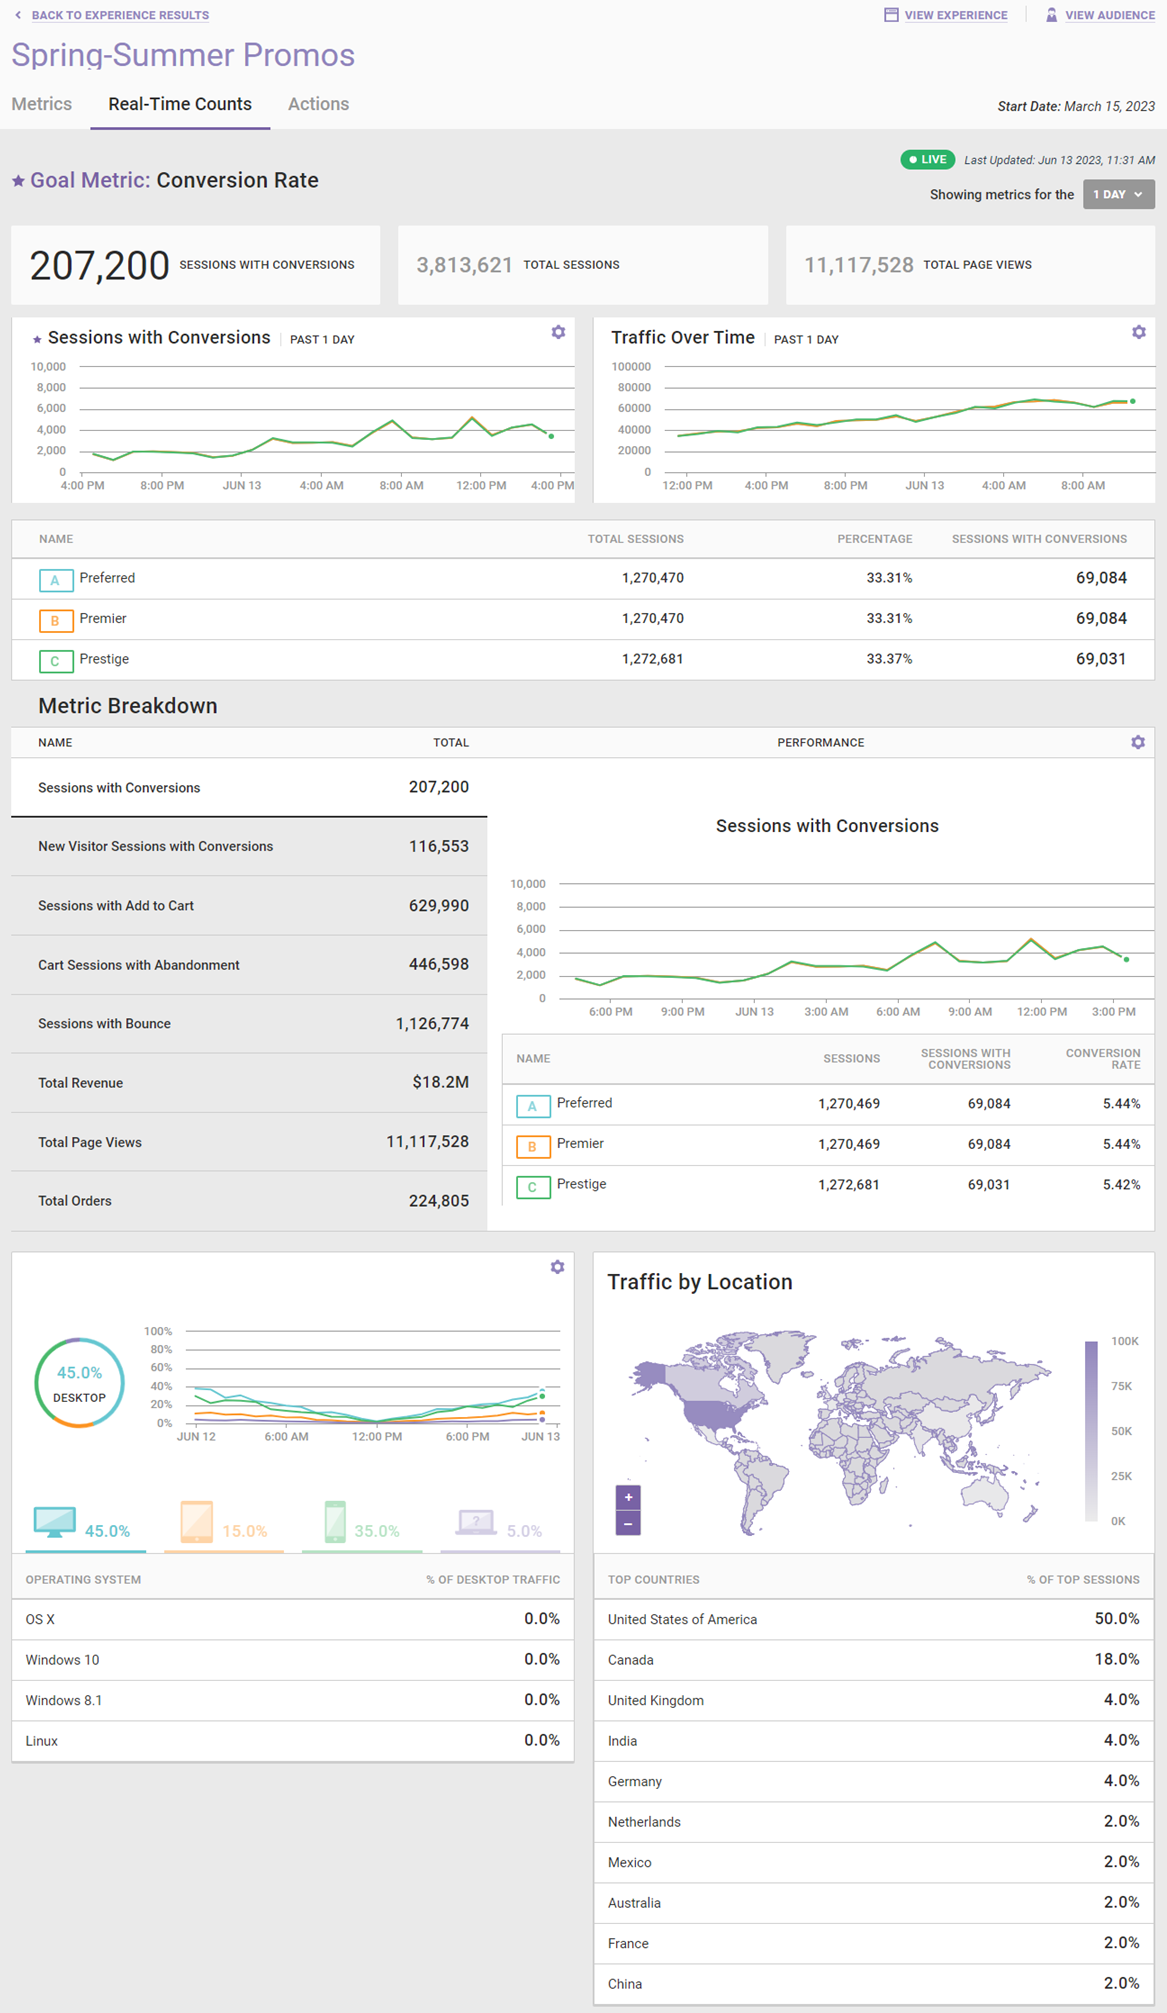
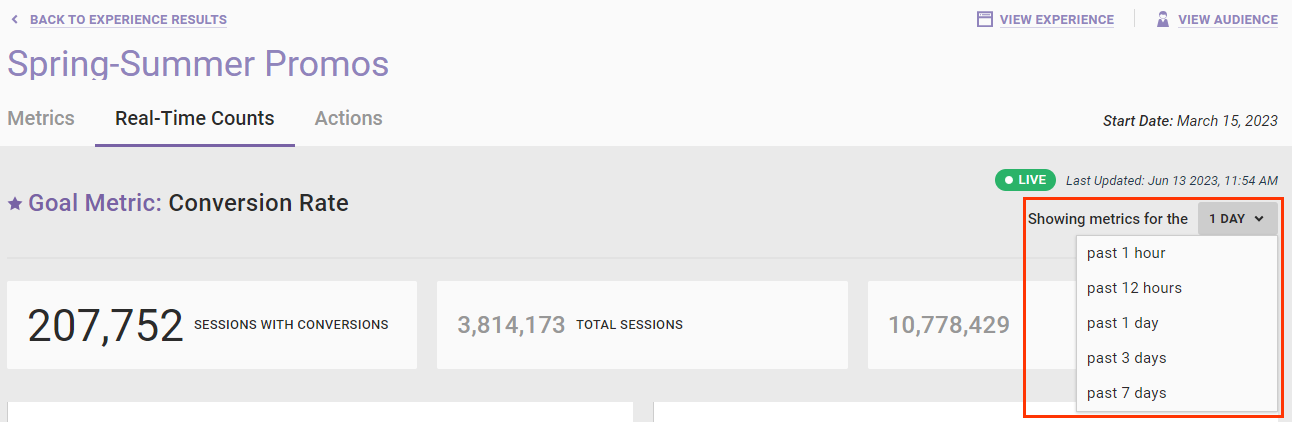
The default lookback period is 1 day, but you can change the view by selecting an option from Showing metrics for the.
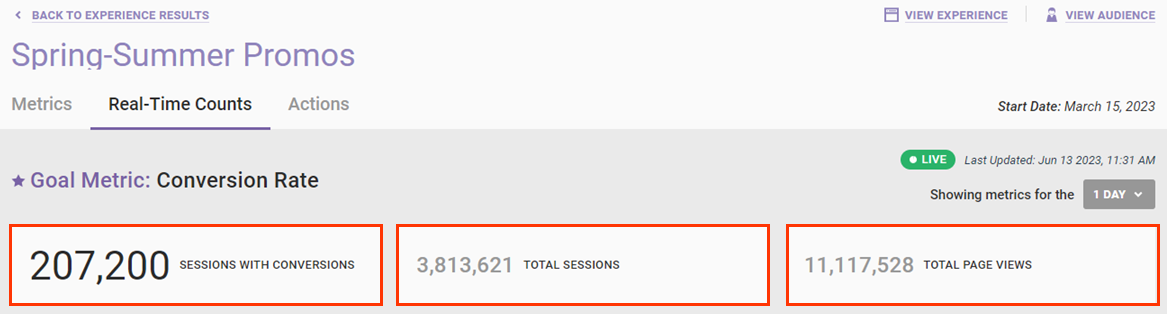
The top three cards on the tab always display the total sessions with the experience's goal metric, the total sessions, and the total page views.
The Sessions widget and the Traffic Over Time widget each displays a breakdown of the experience variants based on the lookback window selected. Place your mouse pointer on any segment of a plotted line to see the details.
![Callout of the 'Sessions with [goal metric]' widget and 'Traffic Over Time' widget](https://dyzz9obi78pm5.cloudfront.net/app/image/id/6488a8da6cefce1600174173/n/analytics-experience-results-real-time-counts-sessions-traffic-over-time.png)
You can change each widget's display from a line graph to a bar chart by clicking the settings cog and then clicking the icon for the display type you want.
Metric Breakdown
The Metric Breakdown widget provides a view of each of the experience's metrics. All the standard metrics have been converted to reflect the non-rate–based mentality (for example, Average Order Value becomes Total Order). Click a metric on the left-hand side to see a graph plotting that metric over time and a table breaking down the numbers by each variant. Place your mouse pointer on any segment of the plotted line to see the details from that moment in time.
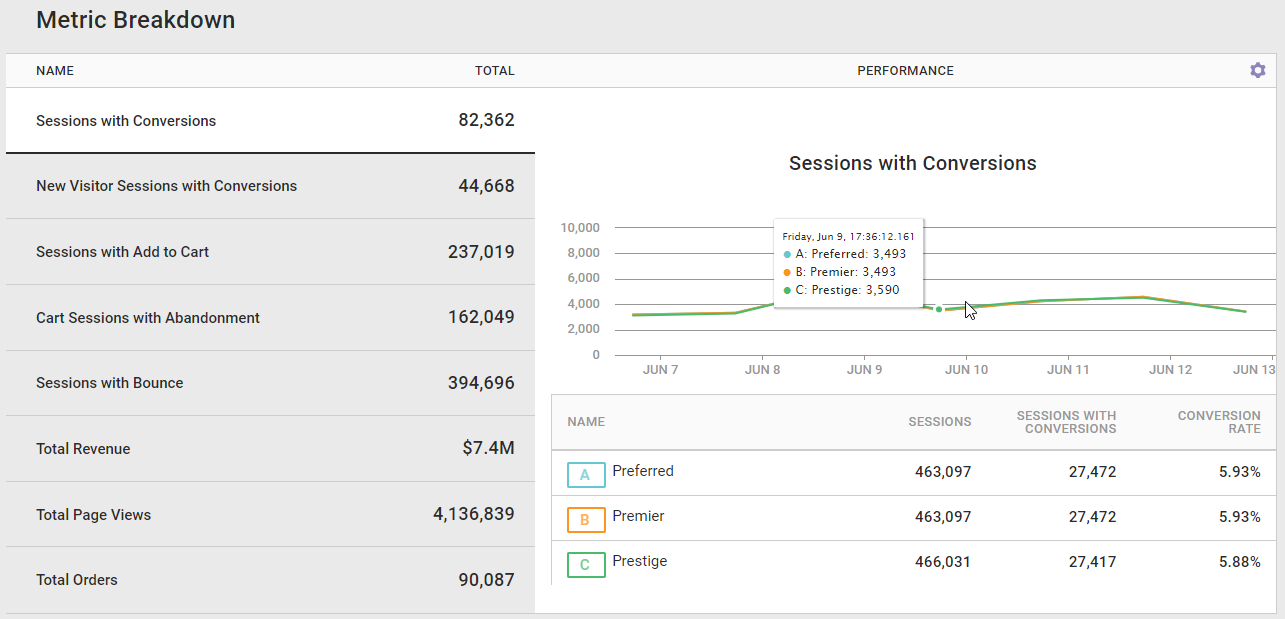
You can change the Performance display from a line graph to a bar chart by clicking the settings cog and then clicking the icon for the display type you want.
Traffic by Device Type
View data about the traffic distribution of sessions by device type—desktop, tablet, mobile, and other devices (for example, smartwatches and smart refrigerators)—and then by operating system for each device type.
Currently you can only target experiences to desktop, tablet, and mobile devices. Game consoles may fall under the Other category. This widget provides instant validation that you have exposed a particular device type to your experience.
Place your mouse pointer on any segment of the plotted line to see the details from that moment in time. You can change the display from a line graph to a bar chart by clicking the settings cog and then clicking the icon for the display type you want.
Traffic by Location
The Traffic by Location widget plots the experience's traffic distribution on a global map. Below the map is a list of up to 10 countries with the highest traffic distribution. This information can help you determine that you've exposed a particular region to the experience.
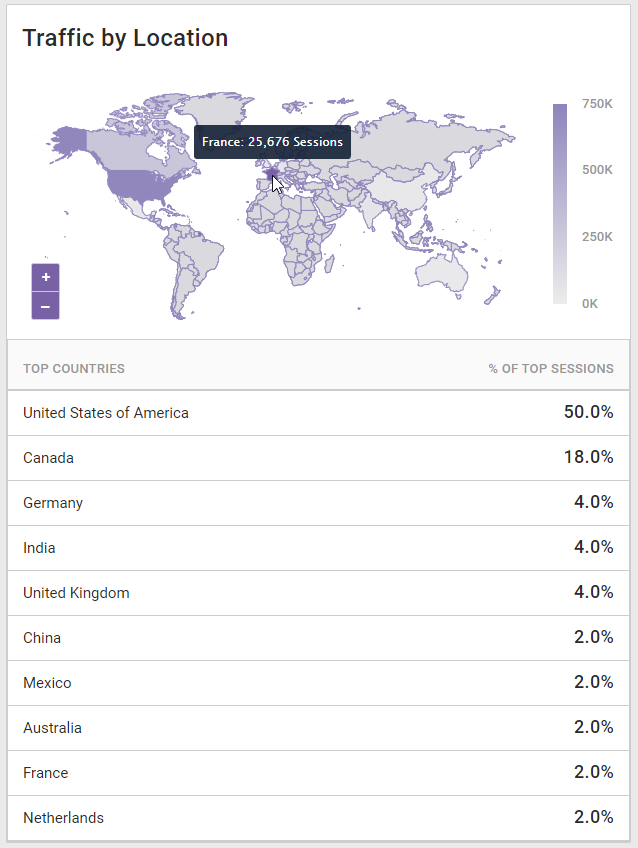
You can zoom in out on the map as well as reposition the map view by using your mouse. To view the exact numbers for a country, place your mouse pointer on it.