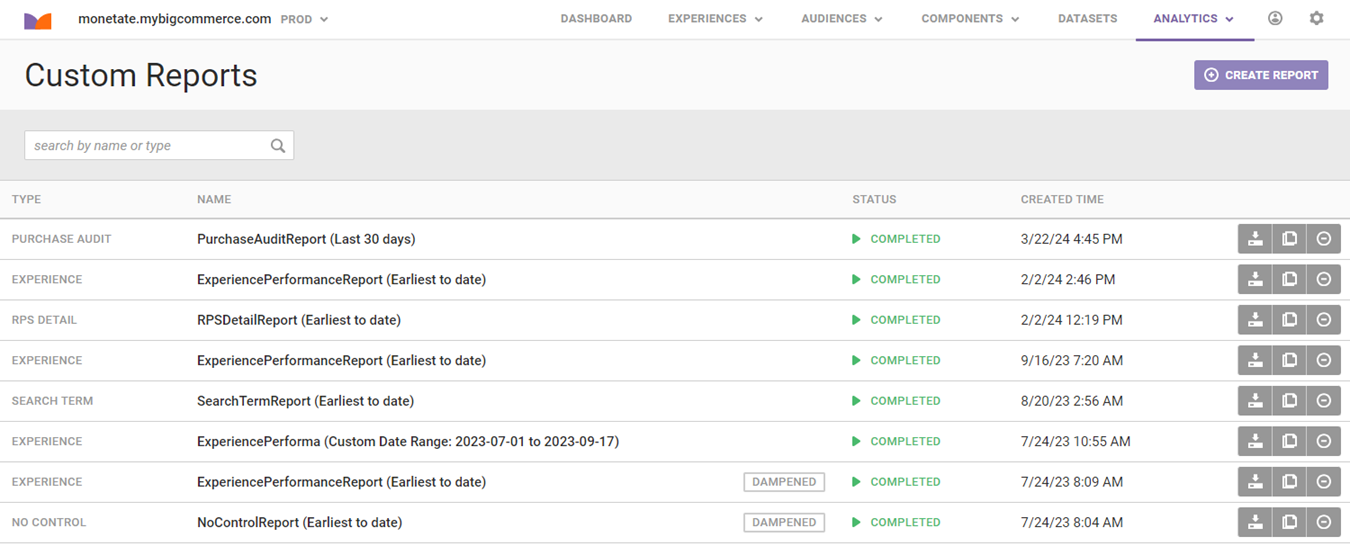
Select Custom Reports from ANALYTICS in the top navigation bar to access a variety of reports about different aspects of the experiences on your site.

When you create a custom report, you can control dampening and determine the number of decimal places in your report, and then download a report as a CSV file for further analysis.
Types of Reports
You can customize and run a variety of reports from the Custom Reports list page.

Experience Performance Report
This report provides an overview of experience-level performance.
In addition to reporting the campaign name and start date, you can configure it to include the following metrics:
- Add to cart rate
- Average order value
- Average page views
- Average time on site
- Bounce rate
- Experience sentence
- Experience status
- Cart abandonment rate
- Control sessions
- Control total sales
- Conversion rate
- Experiment sessions
- Experiment total sales
- New customer acquisition rate
- Number of buyers
- Page events
- Revenue per session
- Units per transaction
The dampening setting allows you to scale purchases in the report that are above the selected threshold to a specific number of standard deviations (SD) above the mean. The default setting is No Dampening.
No Control Experience Performance Report
This report provides an overview of experience-level performance for experiences without a control. It can include the following metrics:
- Add to cart rate
- Average order value
- Average page views
- Average time on site
- Bounce rate
- Experience status
- Cart abandonment rate
- Conversion rate
- Lifetime value
- New customer acquisition rate
- Number of buyers
- Page events
- Revenue per session
- Total sales
- Total sessions
- Units per transaction
Like the Experience Performance Report, the default setting for decimal places in this report is five, and you can adjust it to three. You can also add dampening to this report.
Purchase Audit Report
This report provides an overview of purchases for selected experiences. You can customize it to include these metrics:
- Experience status
- Purchase ID
- Purchase time
- Monetate ID
- Total
- Visit start time
It doesn't include a setting for decimal places nor for dampening.
Purchase Detail Report
This report provides a detailed view of purchases for a selected experience. It can include the following metrics:
- Experience status
- Product ID
- Purchase ID
- Purchase time
- Quantity
- Monetate ID
- SKU
- Total
- Unit price
- Visit start time
This report does not include a setting for decimal places nor for dampening.
Account Dashboard Report
This report provides an overview of experience groups and includes the following time range options for viewing IRR for each experiment within a experience:
- Campaign group
- Campaign
- Active status
- Archived status
- Activation date
- Conversion rate lift
- Conversion rate p-value
- Conversion rate time to significance
- Conversion rate significance
- New customer acquisition rate lift
- New customer acquisition rate p-value
- New customer acquisition rate time to significance
- New customer acquisition rate significance
- Average order value lift
- Average order value p-value
- Average order value time to significance
- Average order value significance
- Revenue per session lift
- Revenue per session p-value
- Revenue per session time to significance
- Revenue per session significance
- Add to cart rate lift
- Add to cart rate p-value
- Add to cart rate time to significance
- Add to cart rate significance
- Cart abandonment rate lift
- Cart abandonment rate p-value
- Cart abandonment rate time to significance
- Cart abandonment rate significance
- Bounce rate lift
- Bounce rate p-value
- Bounce rate time to significance
- Bounce rate significance
- Average page views lift
- Average page views p-value
- Average page views time to significance
- Average page views significance
- Average time on site lift
- Average time on site p-value
- Average time on site time to significance
- Average time on site significance
- Units per transaction lift
- Units per transaction p-value
- Units per transaction time to significance
- Units per transaction significance
- Incremental internal rate of return (IRR) earliest to date
- IRR last 30 days
- IRR last 12 months
This report only pulls experiences with incremental revenue, which occurs only when the revenue-per-session metric reached significance at the confidence interval you selected for the experience.
Referrer Report
This report provides the referrer URL along with the following information:
- Conversion rate
- Bounce rate
- Visits
- Average Page Views
- Average Product Views
You can customize the time frame for this report.
Search Term Report
This report captures the search terms that visitors use to reach your site along with the following information:
- Conversion rate
- Bounce rate
- Visits
- Percentage of visits
You can also select a time range for this report.
Revenue per Session Detail Report
This report provides an overview of the revenue generated by each session on your site and includes the following information:
- Session start time
- Monetate ID
- Campaign name
- Split
- Group
- Revenue
You can also select a time range for this report.
Action Performance Report
This report provides the following information about actions within the selected experiences:
- Campaign
- Split
- Action
- Event
- Event count
- Event session count
- Campaign session count
Viewing Reports
To view the HTML version of a report once it's prepared, click the report name's on the Custom Reports list page. The report opens in a new browser tab.
To download a report as a CSV file, click the download icon at the far right of the report's entry on the Custom Reports list page.
![]()