The analytics that Monetate provides for Product Recommendations for Email experiences differ somewhat from the analytics it provides for traditional Web experiences. Therefore, the Experience Results page for a Product Recommendations for Email experience is slightly different from the Experience Results page for a Web experience.
Accessing an Experience's Results Page
You can access the Experience Results page for a Product Recommendations for Email experience from three different locations:
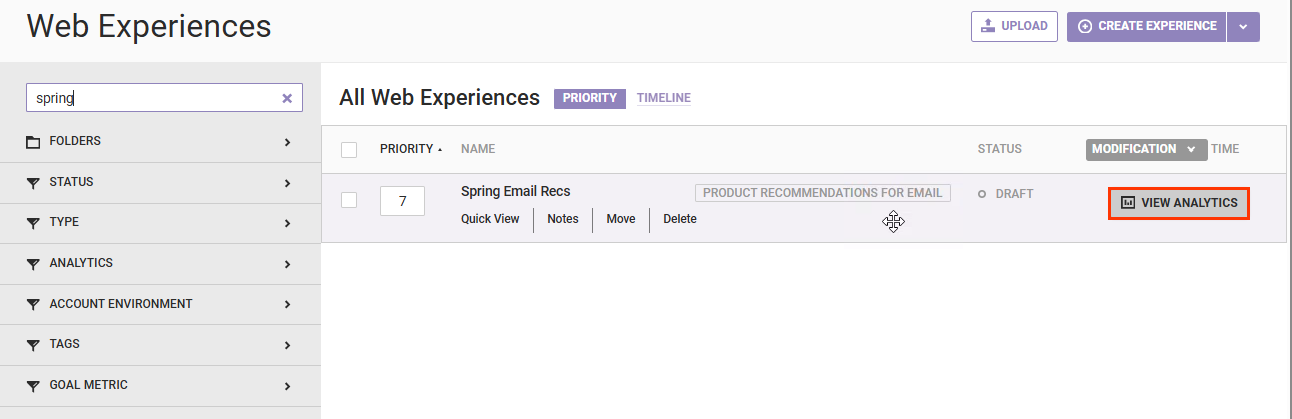
- On the Web Experiences list page, place your mouse pointer on the experience's entry in the table, and then click VIEW ANALYTICS that appears at the far-right side.
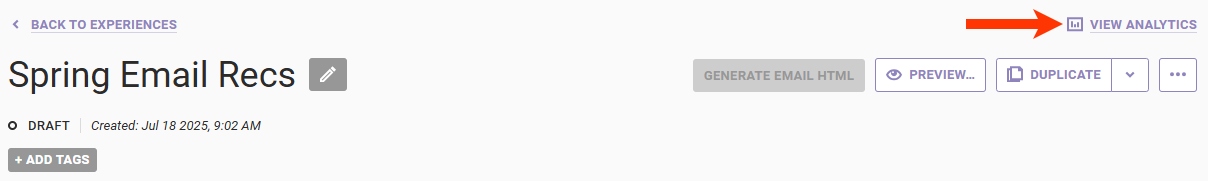
- On the Experience Editor page, click VIEW ANALYTICS.
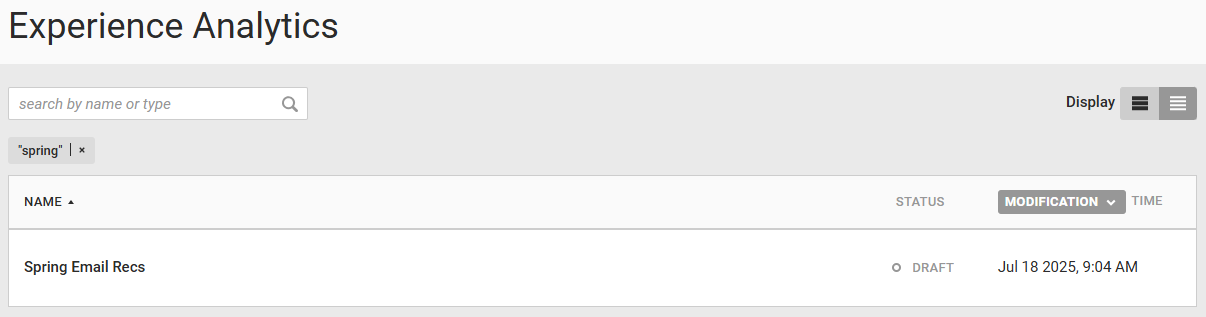
- On the Experience Analytics list page, which you access by selecting Experience Results from ANALYTICS in the top navigation bar, search for the name of the experience, and then click the experience's name.
Regardless of how you access the Experience Results page, it always open on the Metrics tab.
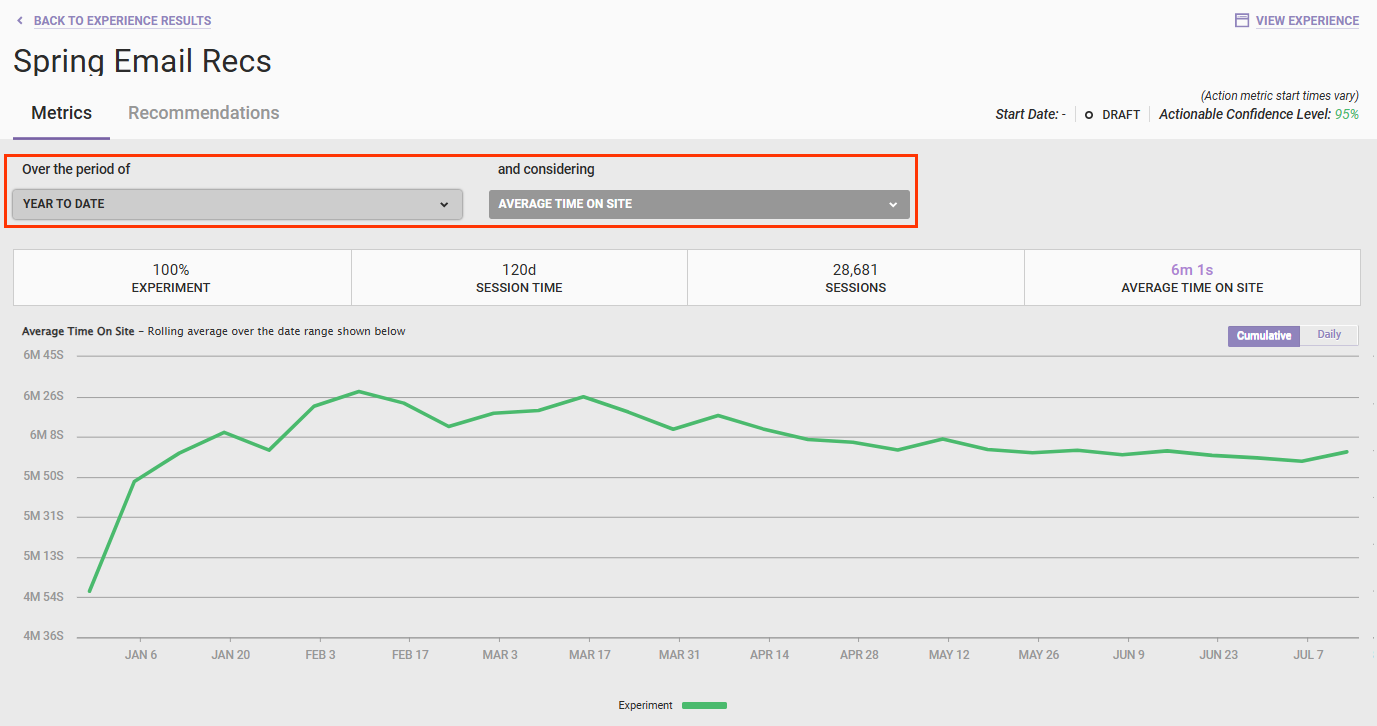
Metrics
The Metrics tab of the Experience Results page displays information about the performance of each metric included in the experience.
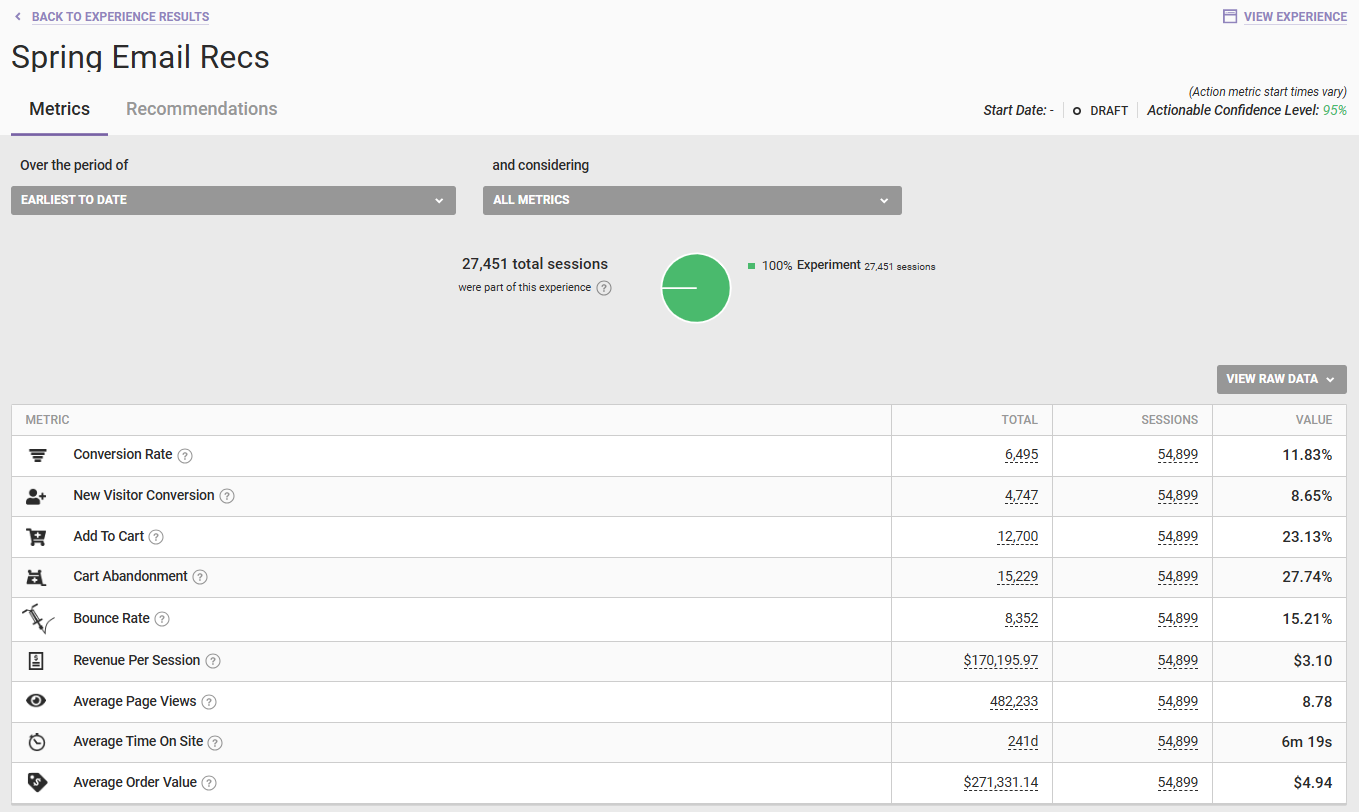
The metrics reported are the same as ones configured on the Default Metrics page of the account settings.
Monetate reports statistical confidence for each metric within the experience. By default, the experience results displays the cumulative results of the experience.
To view a line graph with a breakdown of the experiment for any metric in the experience, select an option from and considering. Select an option from Over the period of to change the date range for the results graphed.
Click Daily in the upper-right corner of the graph to view a version of it that plots the daily values of the metric that you selected over the date range that you selected.
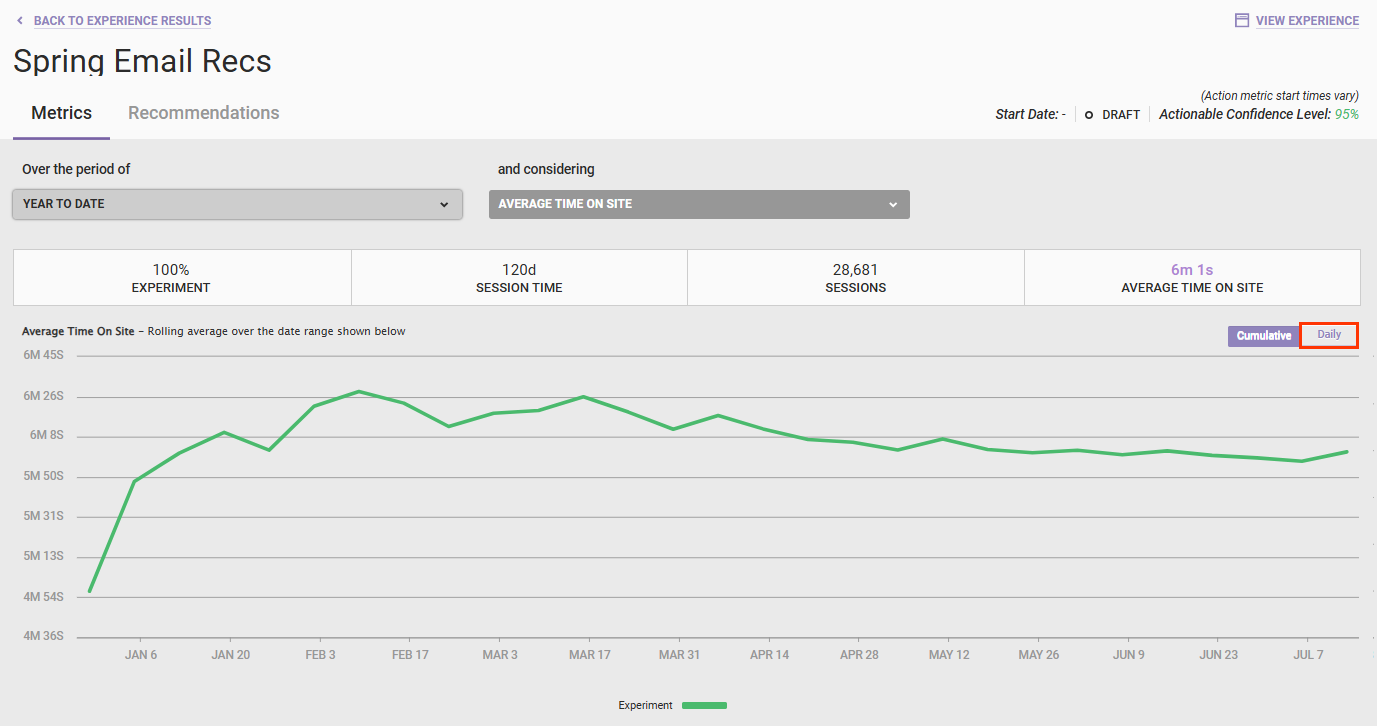
Place your mouse pointer on any position on the line to view a tooltip with a specific value and session count for that place on the timeline of the date range that you selected.
Product Recommendations Reports
The four experience-level product recommendations reports that you can access from the Experience Results page are much like the experience-level reports for Web experiences configured with one or more Product Recommendations actions. Each of the four report focuses on different aspects of the specific Product Recommendations For Email experience so that you can better understand how that experience is performing.
See Product Recommendations Reports Terminology for definitions of various report metrics.
Follow these steps to access one of these reports.
- Navigate to the Experience Results page for the Product Recommendations For Email experience.
- Place your mouse pointer on the Recommendations tab, and then select one of the reports from the menu.
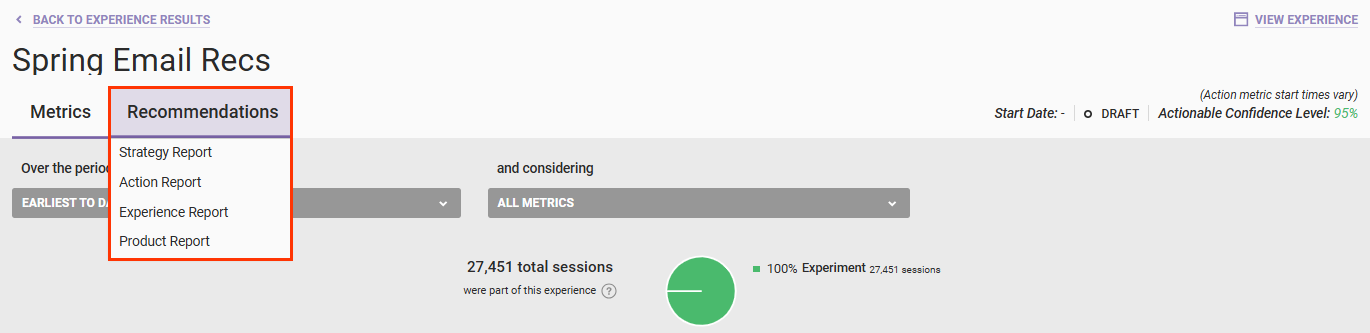
The report that you select opens in a new browser tab.
Refer to Product Recommendations Reports for information about applying filters, downloading a report, and setting up a scheduled delivery of an report.
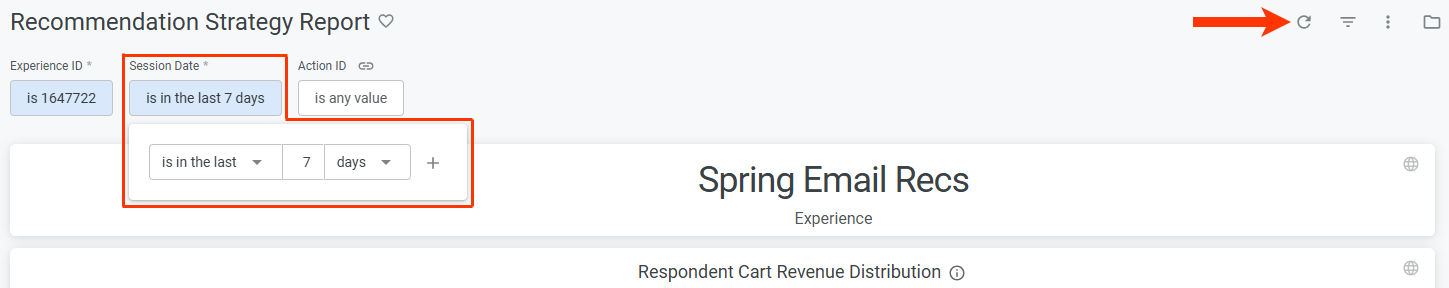
Strategy Report
The Recommendation Strategy Report contains various charts and tables that indicate how the recommendation strategy or strategies selected for the experience's recommendations action has performed over the past 7 days. If the experience has multiple recommendations actions, then each one is listed along with its selected recommendation strategy.
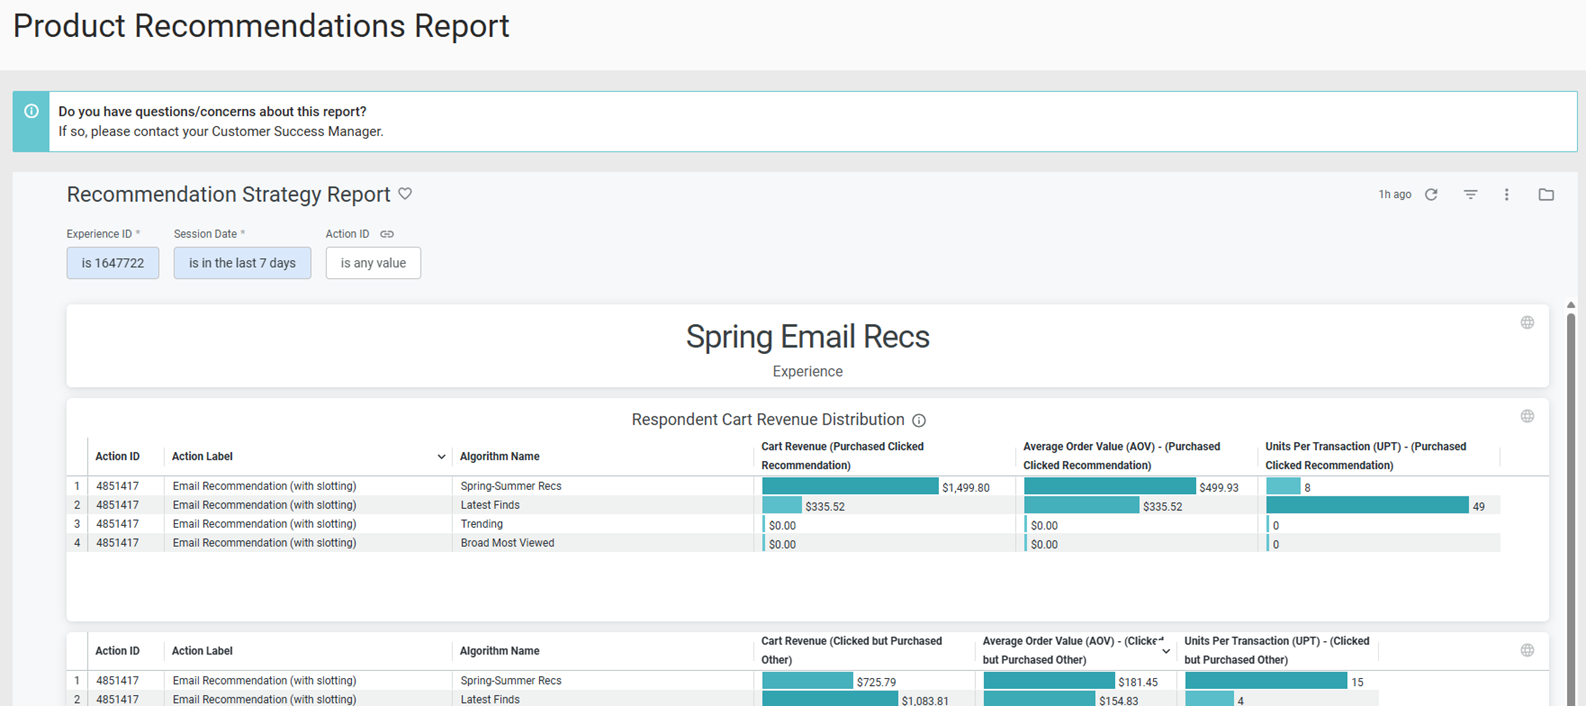
You can adjust the report's lookback period by selecting and configuring as necessary an option from Session Date. After you revise the filter, click the refresh icon.
Action Report
The charts and graphs in the Recommendation Action Report help you understand how the recommendations action in a Product Recommendations for Email experience performed over the last 7 days. This report lists the action configured for the experience but doesn't include each recommendation strategy selected for that action.
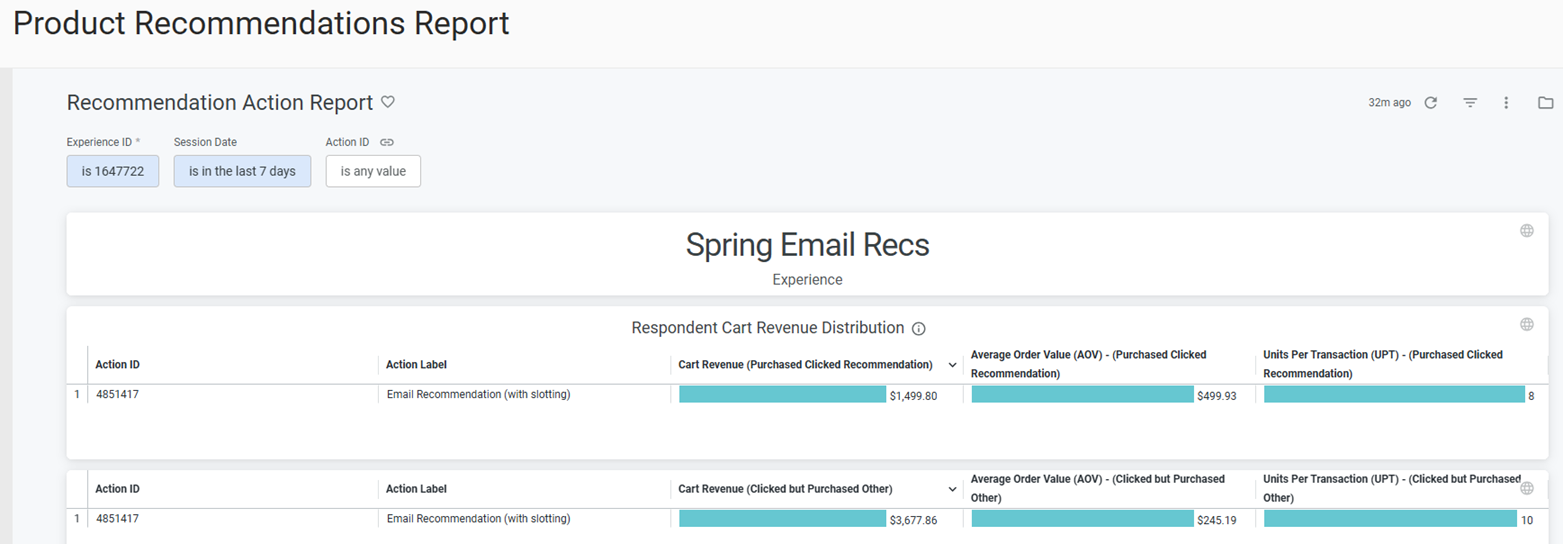
You can adjust the report's lookback period by selecting and configuring as necessary an option from Session Date. If you adjust this filter, ensure that you click the refresh icon.
Experience Report
This report contains various charts and tables that indicate how an experience is performing.
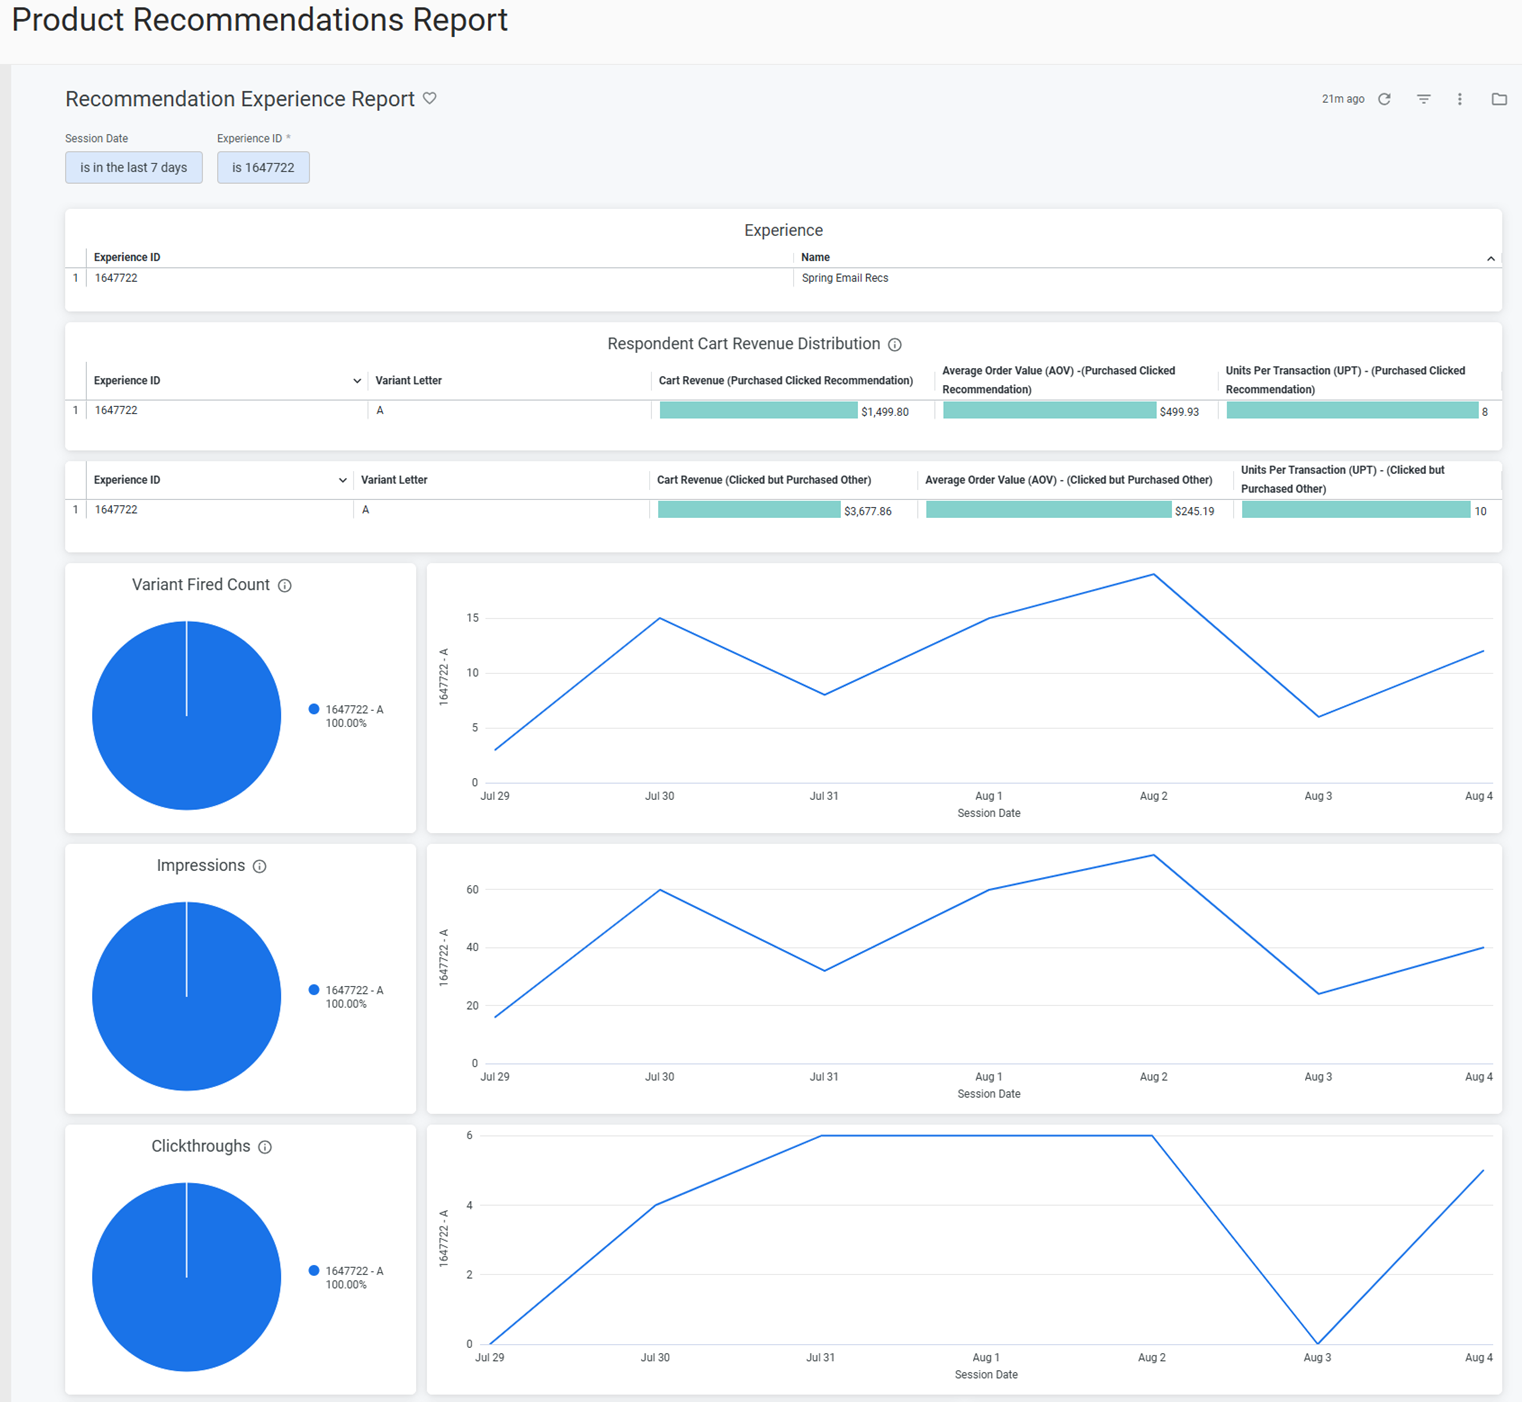
You can adjust the report's lookback period by selecting and configuring as necessary an option from Session Date and then clicking the refresh icon.
Product Report
Select Product Report to view a single table of all products directly and indirectly sold due to recommendations.
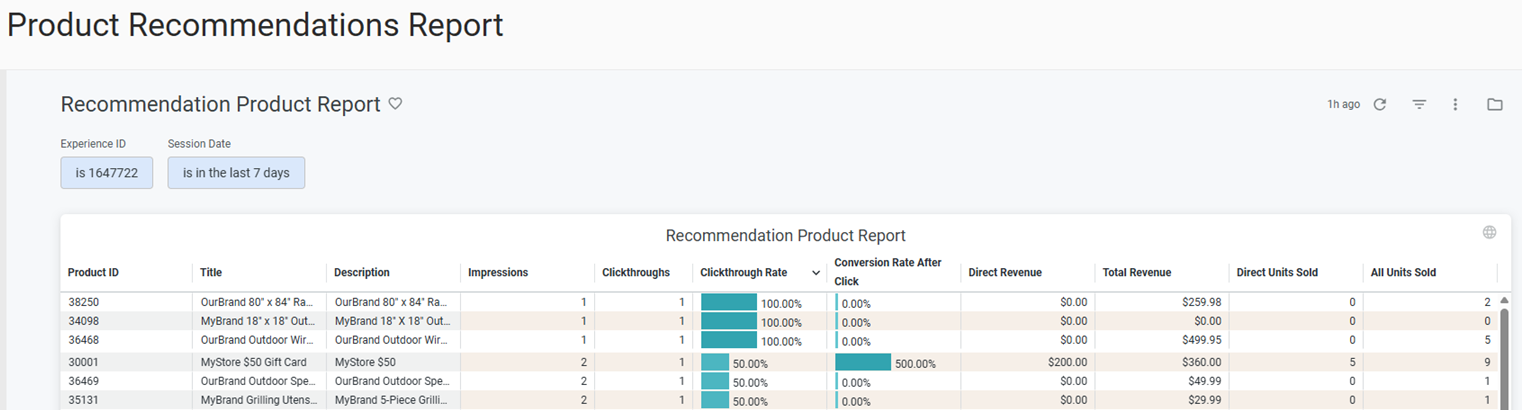
To adjust the report's lookback period, select and configure as necessary an option from Session Date, and then click the refresh icon.