Automated Personalization experiences focus on goal metric performance. Performance data is available as soon as sessions included in the experience end, which occurs after customers are inactive for at least 30 minutes.
Accessing an Experience's Performance Results
Follow these steps to access the performance results for an Automated Personalization experience.
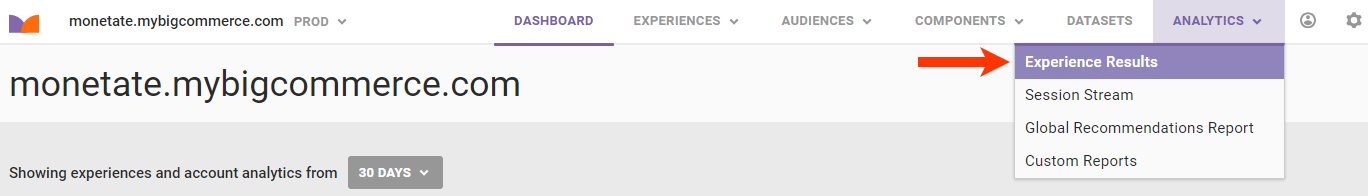
- Click ANALYTICS in the top navigation bar, and then select Experience Results.
- Search for the experience's entry on the Experience Analytics list page.
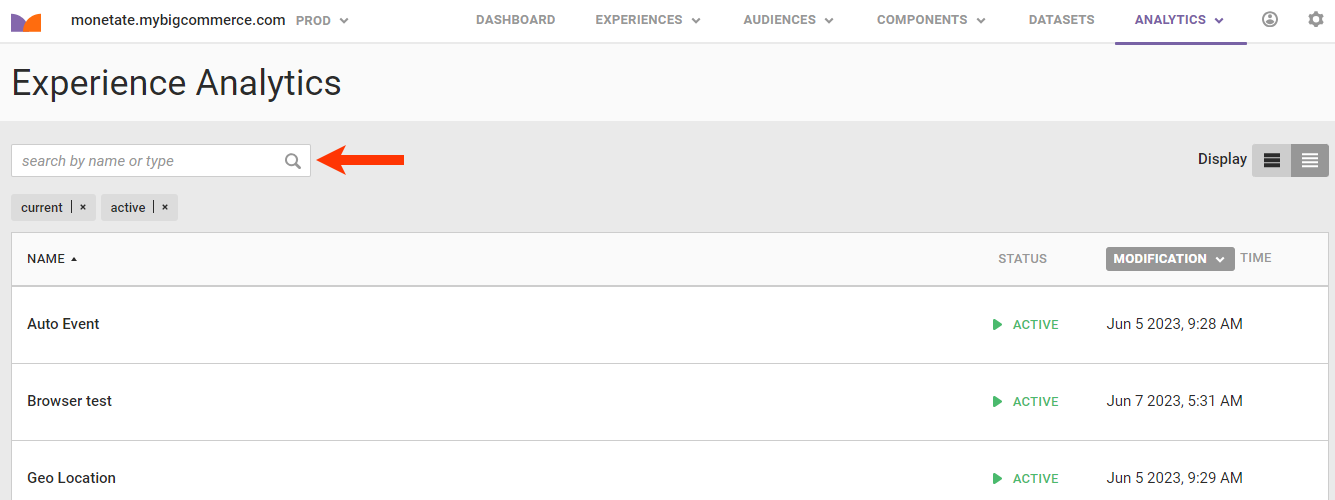
- Click the experience's name.
The Experience Results page opens on the Real-Time Counts tab until the experience has data from at least one session to report. Thereafter, it opens on the Performance tab. New data is available every minute by refreshing the page.
See Real-Time Counts to understand what information about the Automated Personalization experience appears on that tab. See Engine Insights to learn more about the information that appears on the Engine Insights tab.
If the experience includes a recommendations action, then the Recommendations menu appears next to the Real-Time Counts tab. Refer to Experience-Level Reports in Product Recommendations Analytics for more information about the report option available.
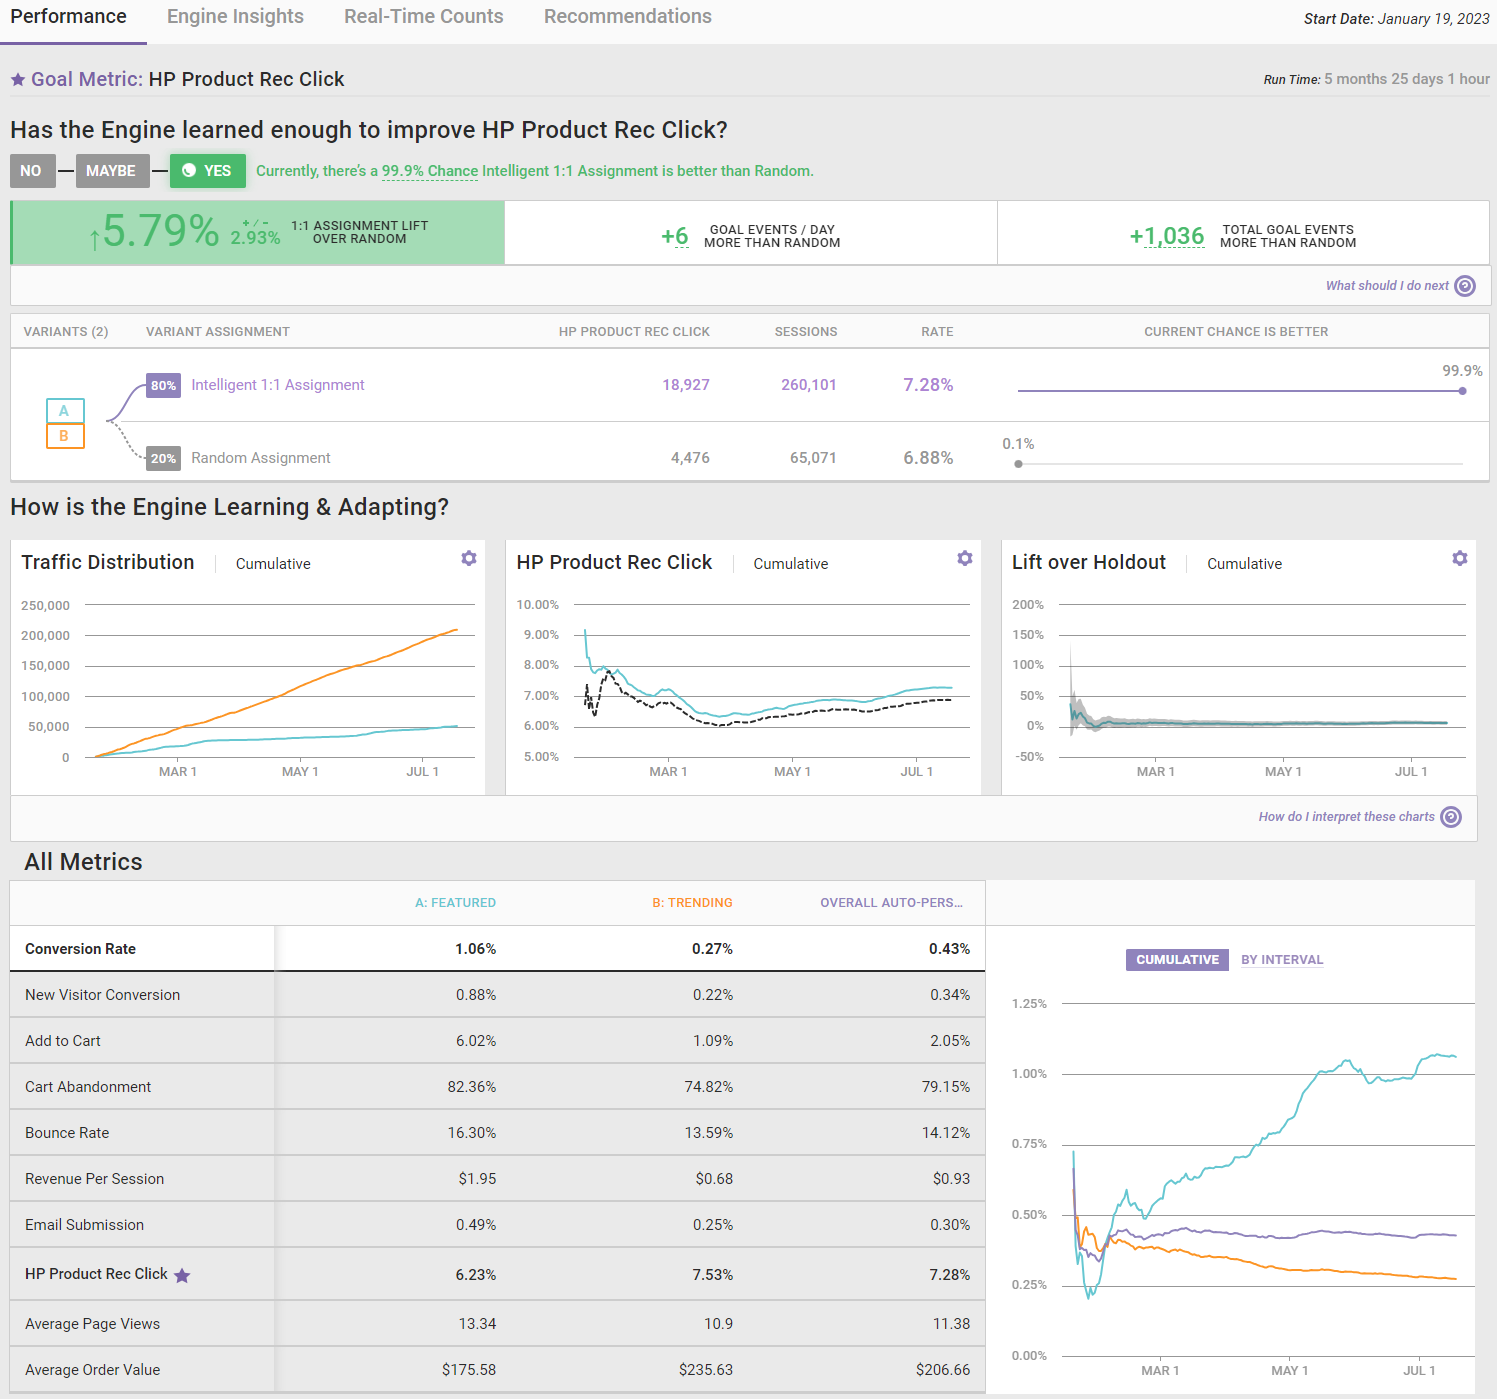
Performance Tab
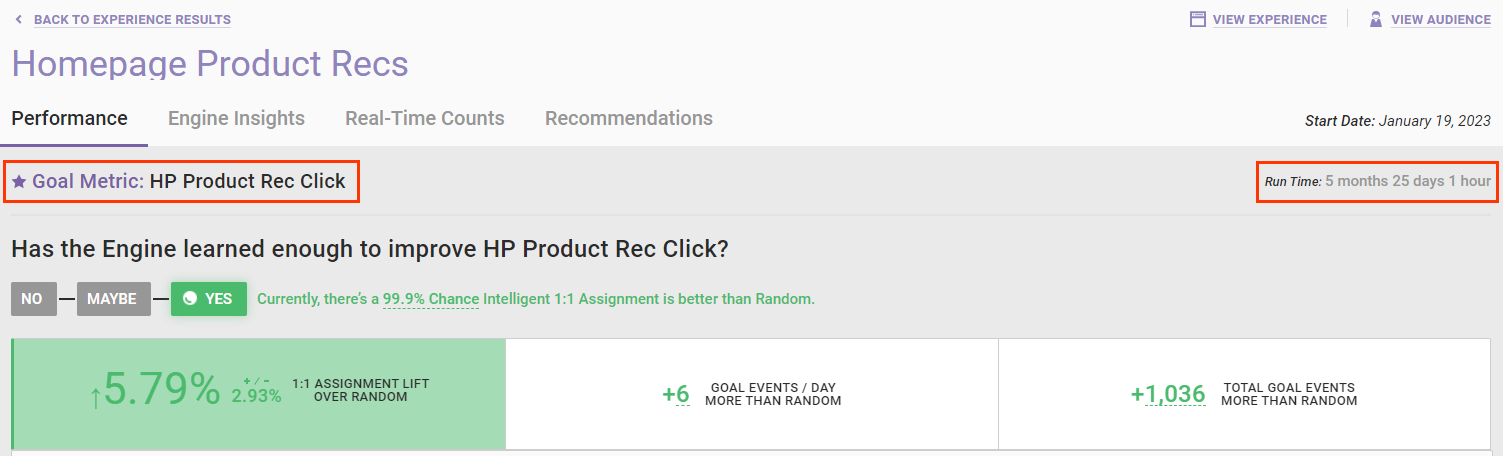
The experience's goal metric appears at the top left of the Performance tab. At the top right of the tab is the experience's run time.
The tab contains three sections. The first focuses on the goal metric. The second focuses on the ongoing performance of the experience. The third reports data for all metrics.
Has the Engine Learned Enough to Improve the Goal Metric?
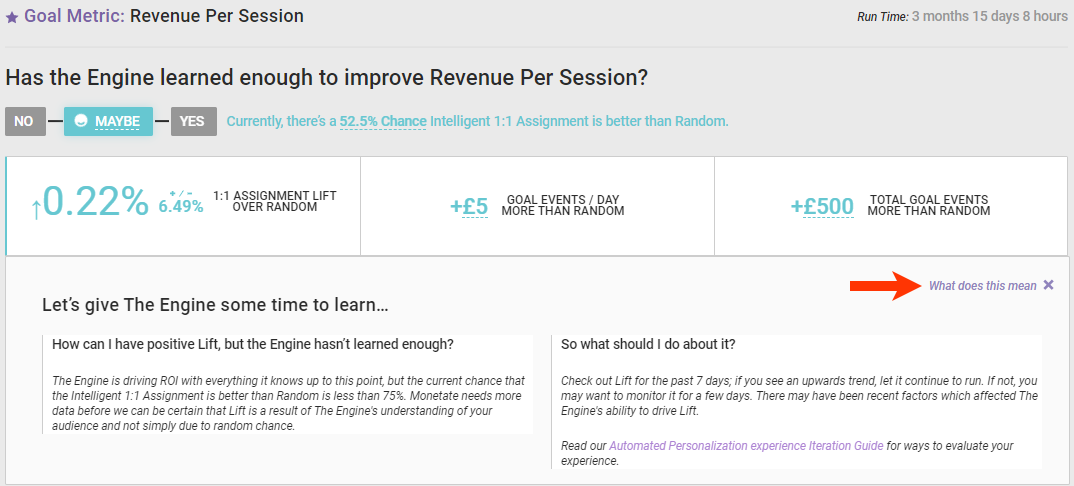
The first section answers the question "Has the Engine learned enough to improve [goal metric]?" and provides the relevant data to back up the answer.
![Example of the 'Has the Engine learned enough to improve [goal metric]?' section and its supporting analytics](https://dyzz9obi78pm5.cloudfront.net/app/image/id/64b69c28fc4911195b205096/n/analytics-auto-personalization-experience-results-performance-has-engine-learned-enough.png)
That data includes the following:
- The percentage of lift that the one-to-one assignment performed over the holdout
- The cumulative total goal events the one-to-one assignment had over the holdout
- The relative impact, which estimates the raw number of goal events gained or lost as a result of the experience's performance over the holdout and is calculated by dividing the cumulative additional goal events more than the holdout by the experience's run time to arrive at the average additional goal events the experience gained or lost per day
You shouldn't attribute the relative impact to a single experience because customers could have interacted with other experiences on your site.
Chance Intelligent Assignment Is Better Percentage Categories
The percentage chance that the one-to-one assignment is better is categorized as follows:
- Very High: 95–99.9%
- High: 75–94.9%
- Medium: 50–74.9%
- Low: 0–49.9%
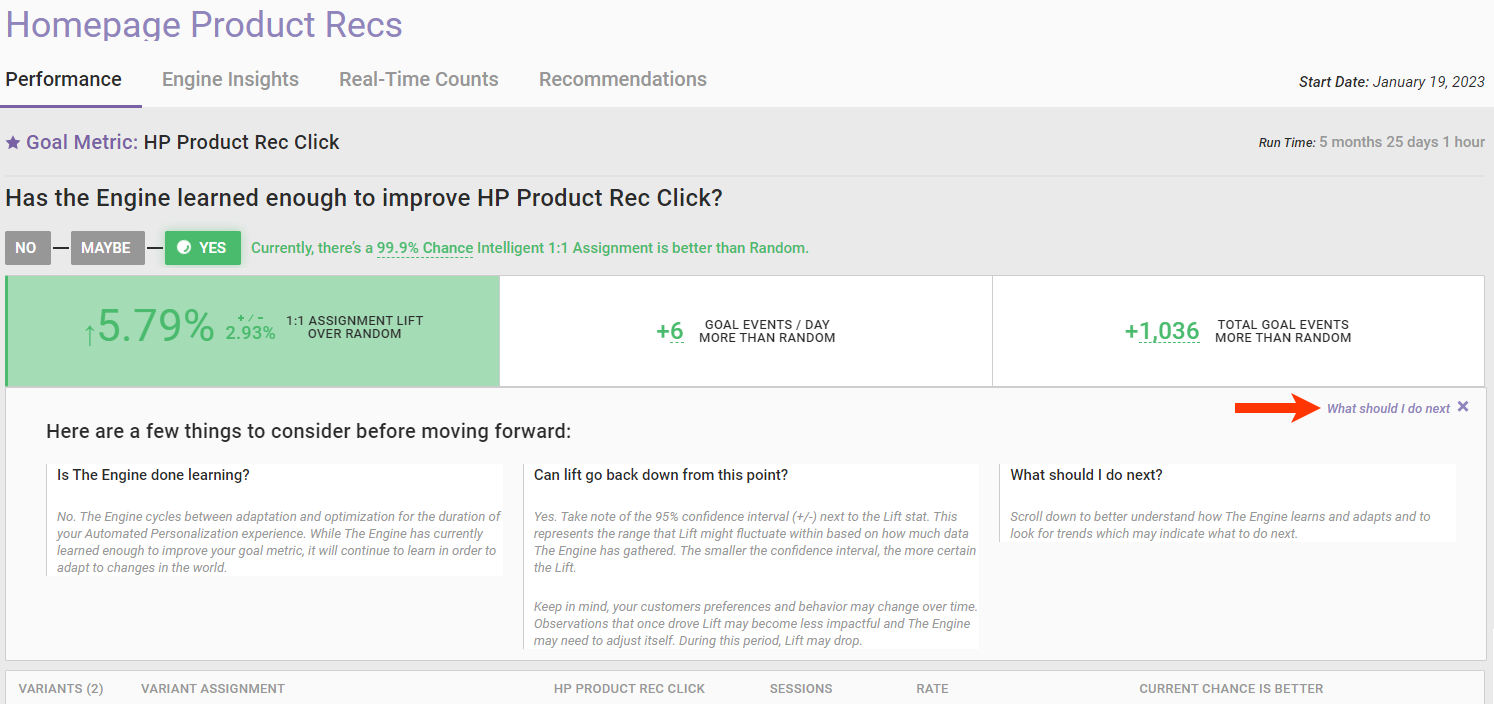
If the percentage chance falls into the High or Very High category, then the answer to the question "Has the Engine learned enough to improve [goal metric]?" is "Yes." Click What should I do next that appears under the cumulative total of goal events for suggested next steps.
If the percentage chance falls into the Medium category, then the answer to the question "Has the Engine learned enough to improve [goal metric]?" is "Maybe." Click What does this mean that appears under the cumulative total of goal events for suggested next steps.
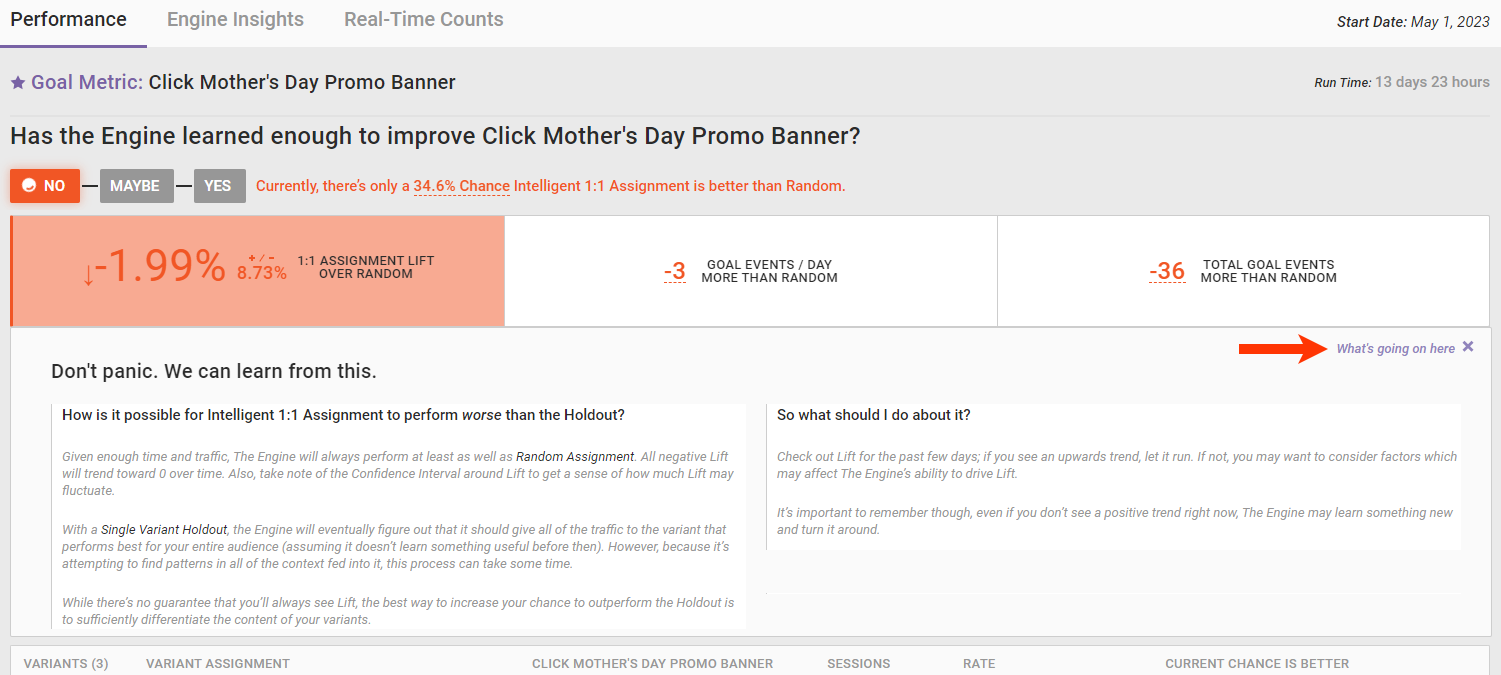
If the percentage chance falls into the Low category, then the answer to the question "Has the Engine learned enough to improve [goal metric]?" is "No." Click What's going on here that appears under the cumulative total of goal events for suggested next steps.
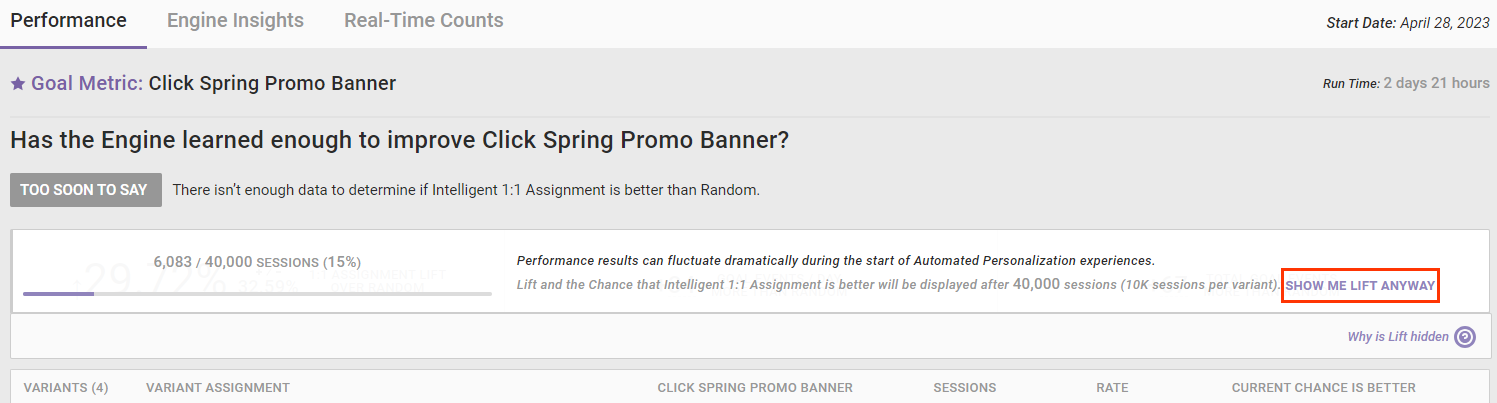
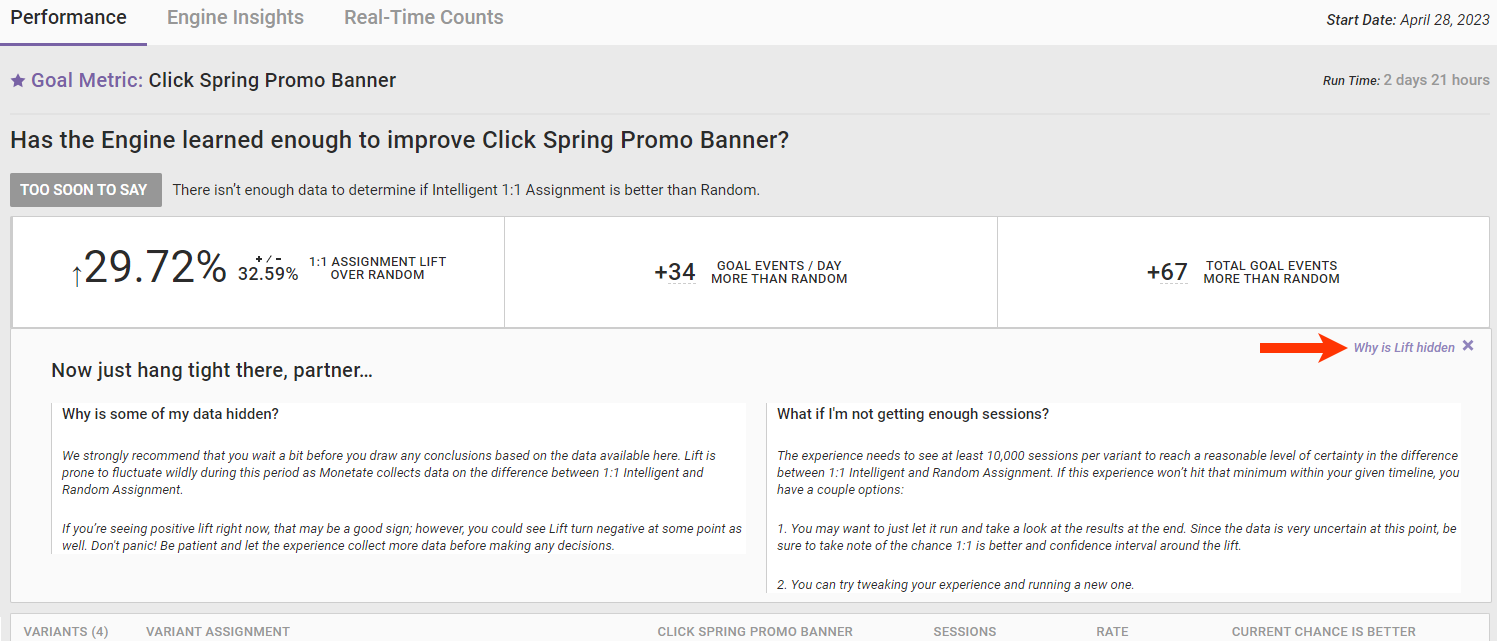
Occasionally the Personalization engine hasn't collected enough data to answer the question "Has the Engine learned enough to improve [goal metric]?" In that situation the answer is "Too soon to say." In this situation the number of sessions recorded along with the minimum sessions required for the Engine to answer the question appears instead of the lift. You can view the lift by clicking SHOW ME LIFT ANYWAY.
Click Why is Lift hidden for more information on what the Engine is doing.
Variants Widget
Automated Personalization experiences match each customer to the right variant by optimizing the goal metric. Below the lift calculations is the Variants widget, which displays the performance of variants that were part of the Automated Personalization algorithm and the performance of the holdout that used random assignment among the variants.
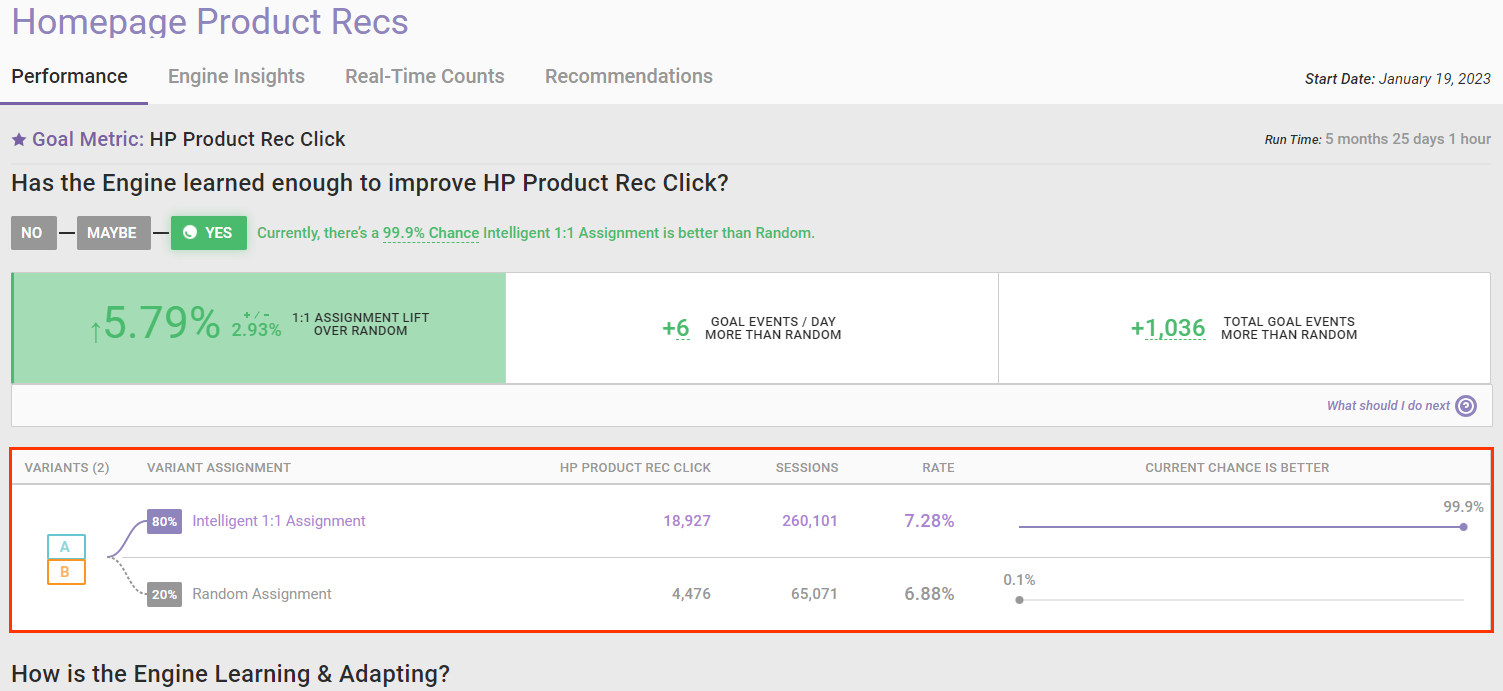
This screenshot shows that the one-to-one assignment variants had a goal rate of 7.28%, and the random assignment variants had a goal rate of 6.88%.
How Is the Engine Learning and Adapting?
The second section of the Performance tab answers the question "How is the Engine learning and adapting?" with data about variant traffic distribution, goal metric performance, and lift performance.
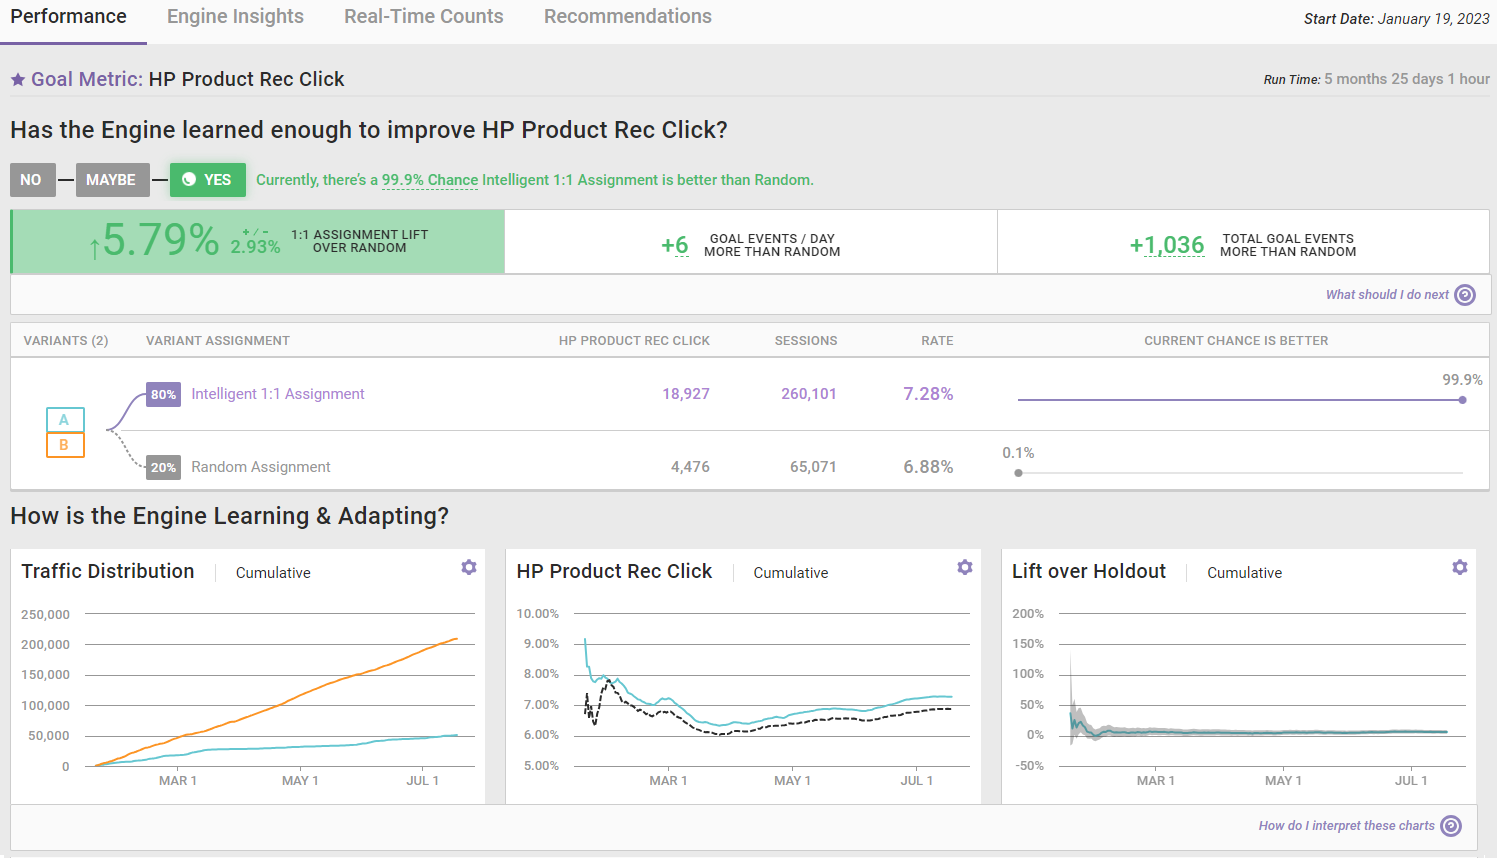
Each of the three widgets in this section has two modes: Cumulative and By Interval. You can toggle between modes by clicking the settings cog that each widget has and then selecting the view you want.
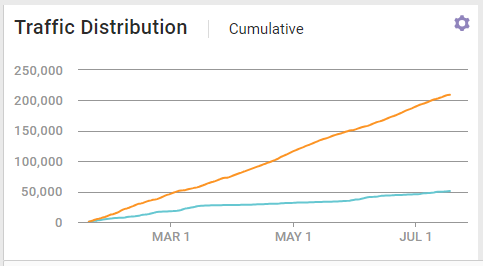
Traffic Distribution
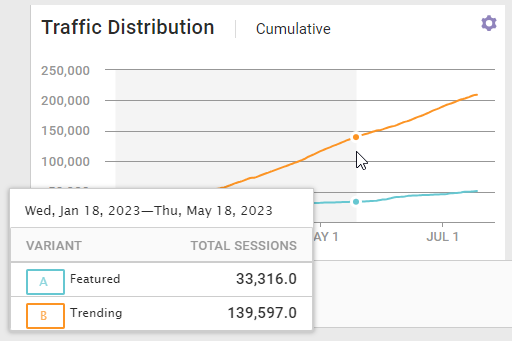
The Traffic Distribution widget provides insight into the traffic breakdown over time for each variant. It's helpful for seeing how the Engine has learned from visitor behavior and routed traffic accordingly.
This screenshot shows the cumulative view of the Traffic Distribution widget.
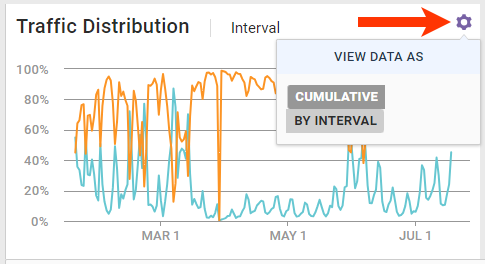
Click the settings cog and then select the mode you want to see.
Place your mouse pointer on any segment of any line on the Traffic Distribution widget's cumulative view, and a pop-up appears that lists each variant and its respective total cumulative sessions from the start of the experience to the specific date on which you placed the mouse pointer.
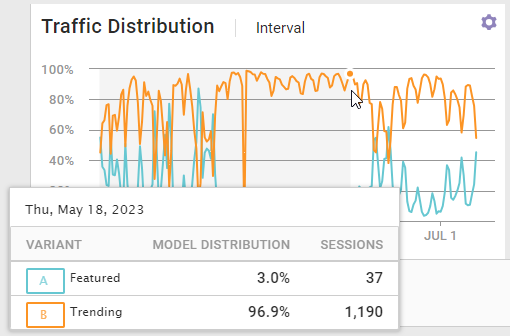
When viewing the By Interval mode of the Traffic Distribution widget, placing your mouse pointer on any segment of any line results in a pop-up that lists each variant and its respective model distribution percentage and total sessions on the specific date on which you place the mouse pointer.
Dismiss any pop-up by moving the mouse pointer.
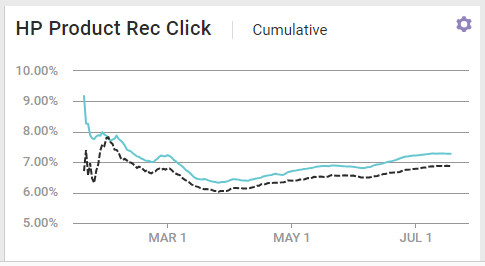
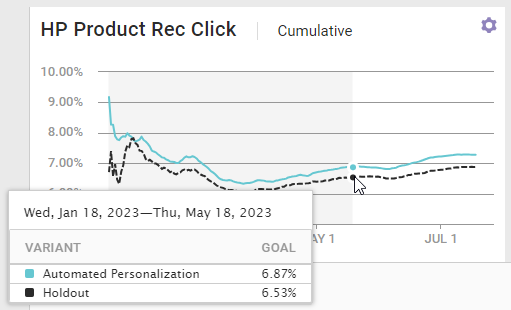
Goal Metric Performance
The data displayed in the goal metric performance widget helps you understand how the Personalization engine drives goal metric lift over the random assignment.
This screenshot shows the cumulative view of the goal metric performance widget.
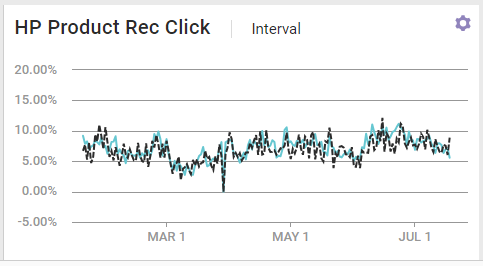
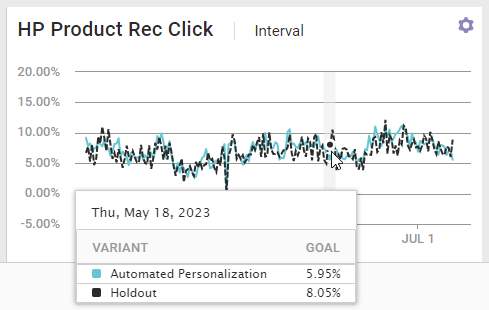
The interval view, shown in this screenshot, is available by clicking the settings cog and then selecting BY INTERVAL.
Place your mouse pointer on any segment of any line on the goal metric performance Cumulative mode, and a pop-up appears that shows the percentages for the one-to-one assignment and random assignment from the start of the experience to the specific date on which you placed the mouse pointer.
When viewing the By Interval mode of the goal metric performance widget, placing your mouse pointer on any segment of any line results in a pop-up that shows the goal metric performance percentage for the one-to-one assignment and random assignment on the specific date on which you place the mouse pointer.
Dismiss any pop-up by moving the mouse pointer.
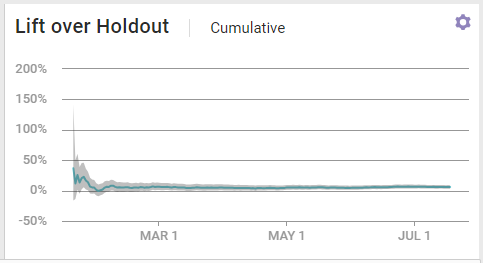
Lift over Holdout
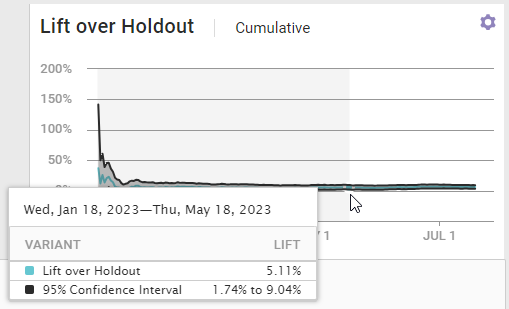
The Lift over Holdout widget shows how the experience's lift changes over time. This screenshot shows the cumulative view of the widget.
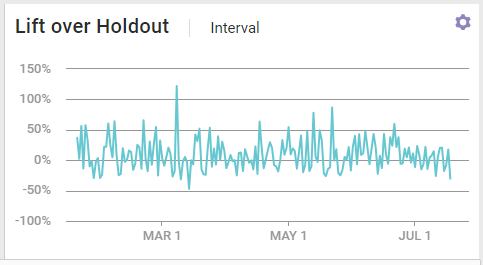
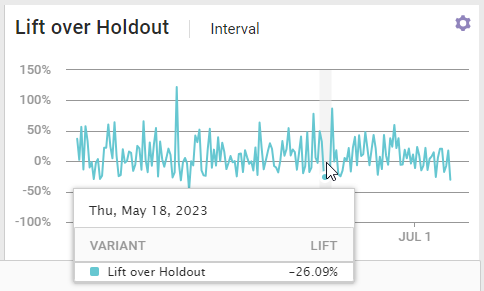
The interval view, shown in this screenshot, is available by clicking the settings cog and then selecting BY INTERVAL.
Place your mouse pointer on any segment of the Lift over Holdout cumulative view, and a pop-up appears that shows the percentage lift of the one-to-one assignment over the random assignment for the one-to-one assignment and random assignment along with the percentage range of of the 95% confidence level, both measured from the start of the experience to the specific date on which you placed the mouse pointer.
When viewing the By Interval mode of the Lift over Holdout widget, placing your mouse pointer on any segment results in a pop-up that shows the percentage of the one-to-one assignment's lift over the random assignment on the specific date on which you place the mouse pointer.
Dismiss any pop-up by moving the mouse pointer.
For additional assistance understanding the data presented in the three widgets, click How do I interpret these charts that appears under the Lift over Holdout widget. An accordion then appears with a tab for each widget.
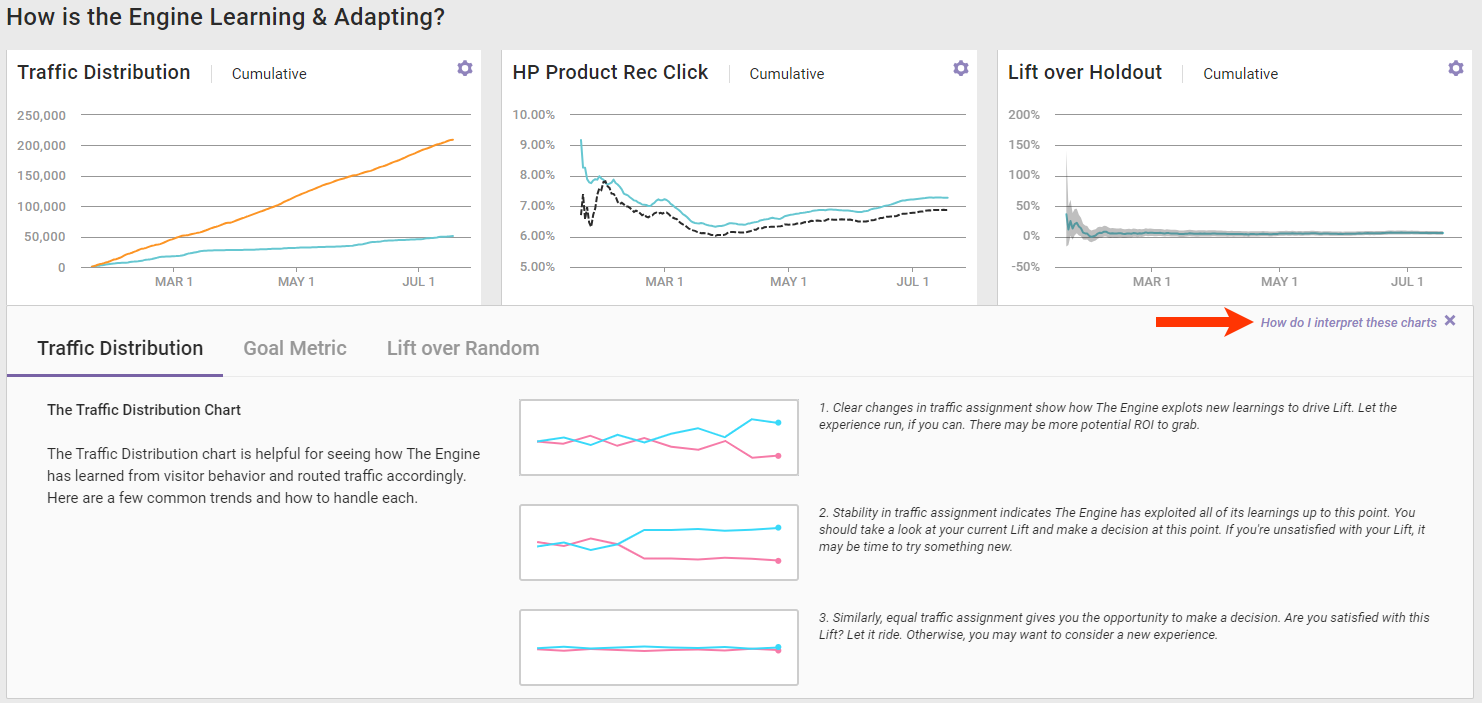
Each tab containing tips for interpreting the data for its respective widget.
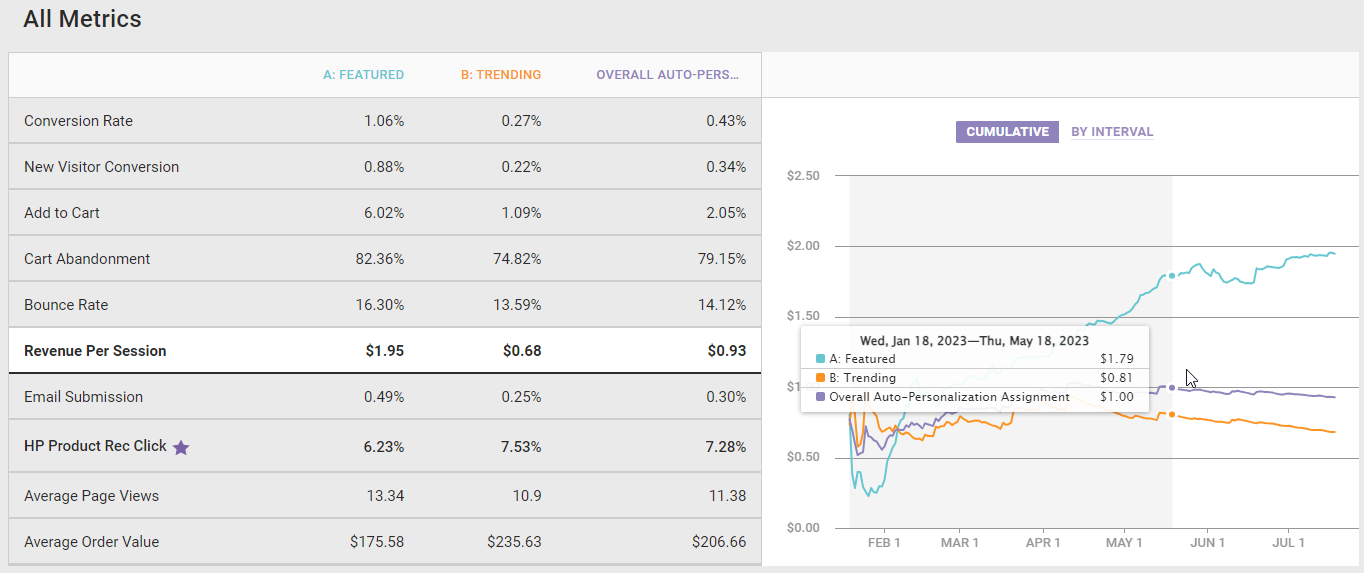
All Metrics
Use the All Metrics widget to view the individual performance of the goal metric and each secondary metric of the experience by variant and the overall Automated Personalization assignment.
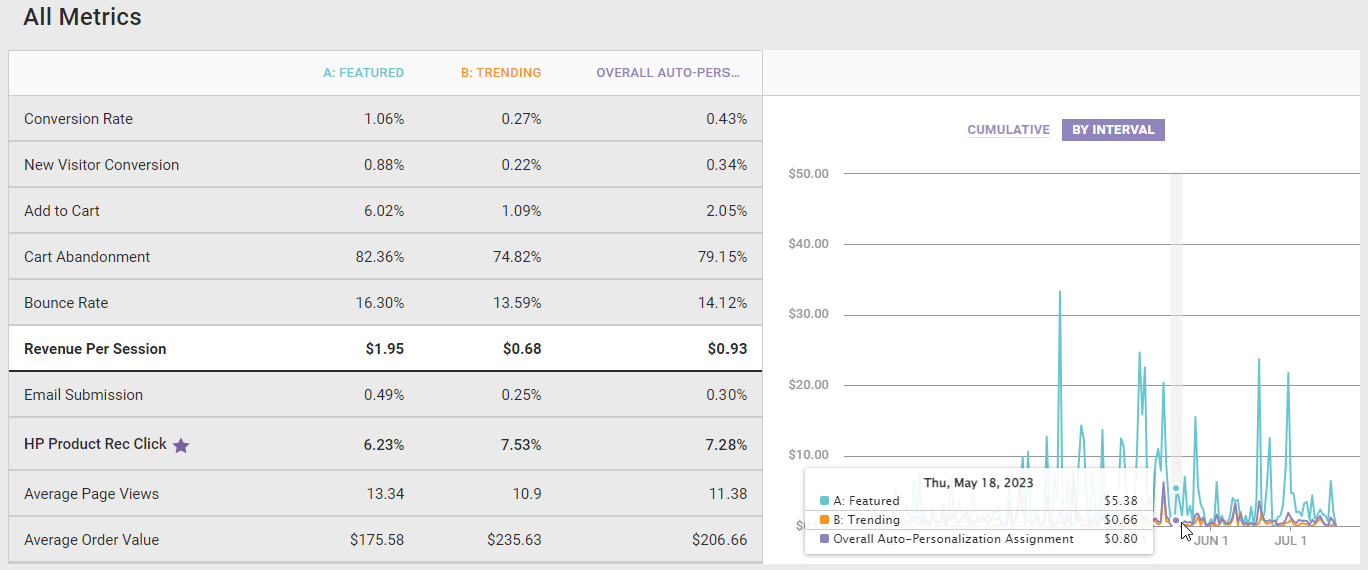
Click a metric listed in the table to view its performance-over-time graph. You can change the graph mode from cumulative to interval by clicking BY INTERVAL. Change the mode back by clicking CUMULATIVE.
When you place your mouse pointer on any segment of any line of the graph in Cumulative mode, a pop-up appears that shows the performance of each variant along with the performance of the overall Automated Personalization experience for the selected metric that is measured from the start of the experience to the specific date on which you placed the mouse pointer.
When viewing the By Interval mode, placing your mouse pointer on any segment of any line results in a pop-up that shows the performance of each variant along with the performance of the overall Automated Personalization experience for the selected metric on the specific date on which you place the mouse pointer.
Dismiss any pop-up by moving the mouse pointer.