You can access three global reports and four experience-level reports, all with specific filters applied, within Monetate. They help you better understand how recommendations are performing at the account level and experience level.
See Product Recommendations Reports Terminology for definitions of various report metrics.
Global Reports
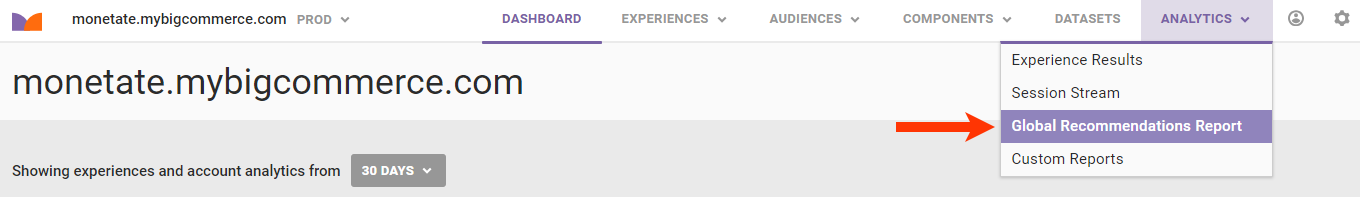
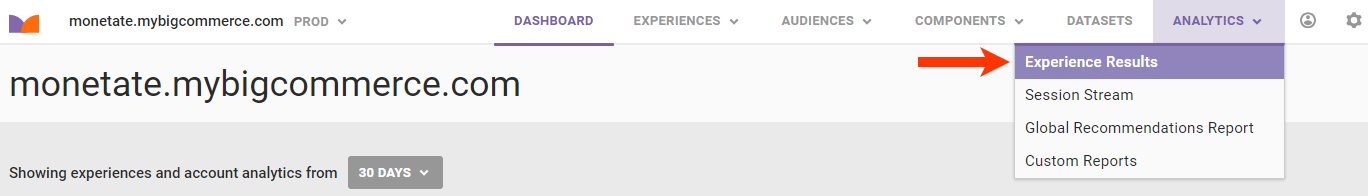
The three global reports offer a high-level view of how recommendations are performing. Access the Recommendation Account Report, the Recommendation Experience Report (All), and the Recommendation Product Report by selecting Global Recommendations Reports from ANALYTICS in the top navigation bar.
Recommendation Account Report
The Recommendation Account Report on the Account Summary tab contains charts and tables that indicate the overall performance of an account's recommendations program, specifically focusing on the impact that respondents have compared to visitors who didn't respond to the recommendations.
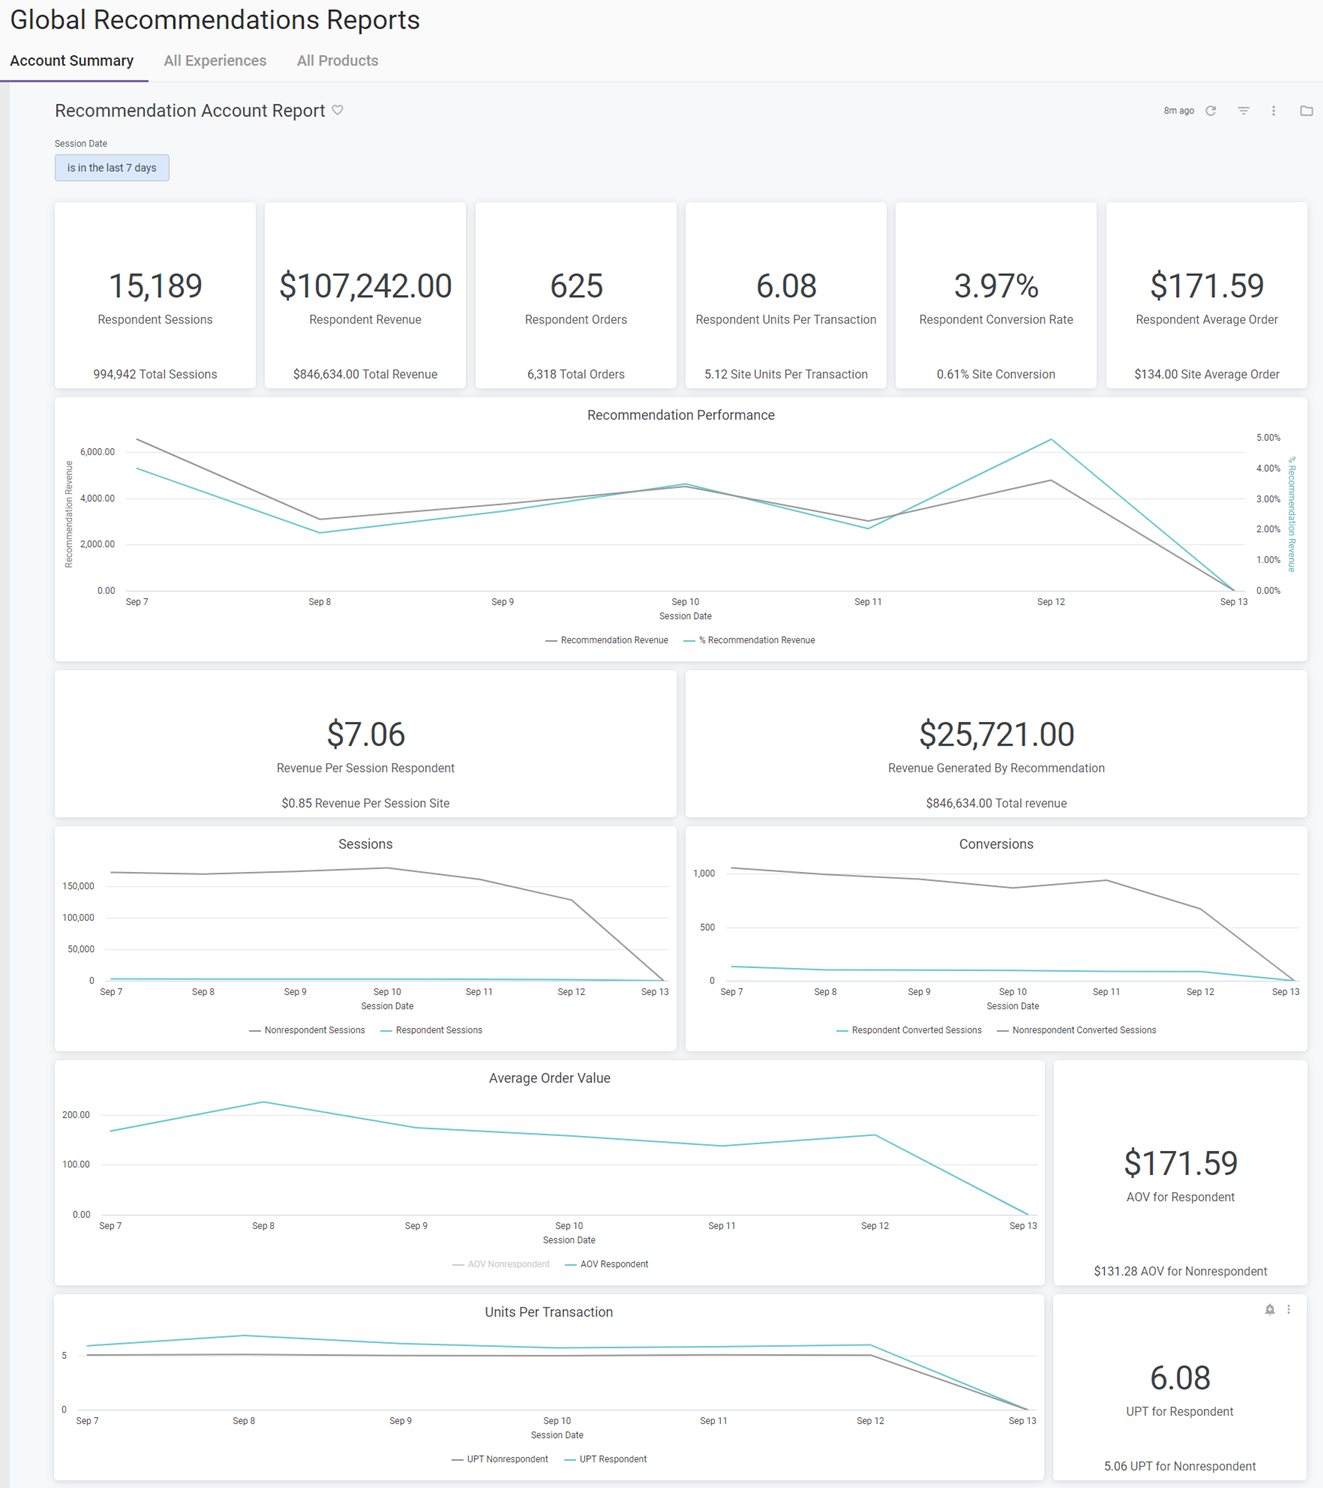
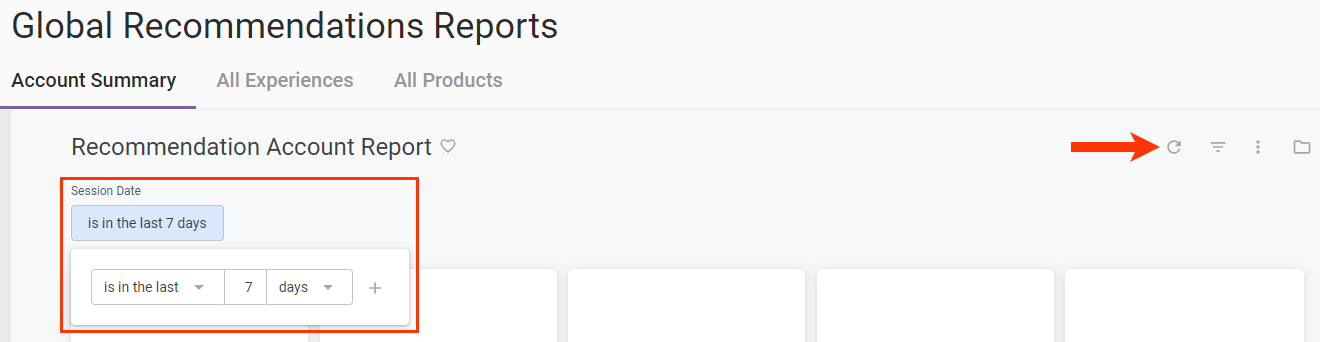
You can change the lookback period by selecting an option from Session Date and then clicking the refresh icon.
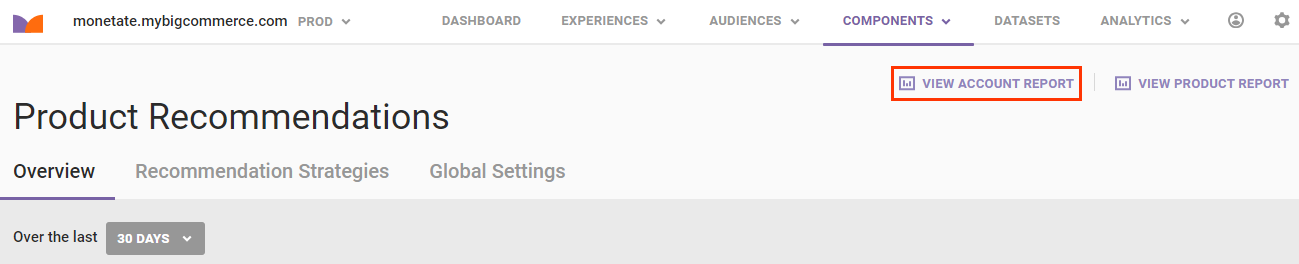
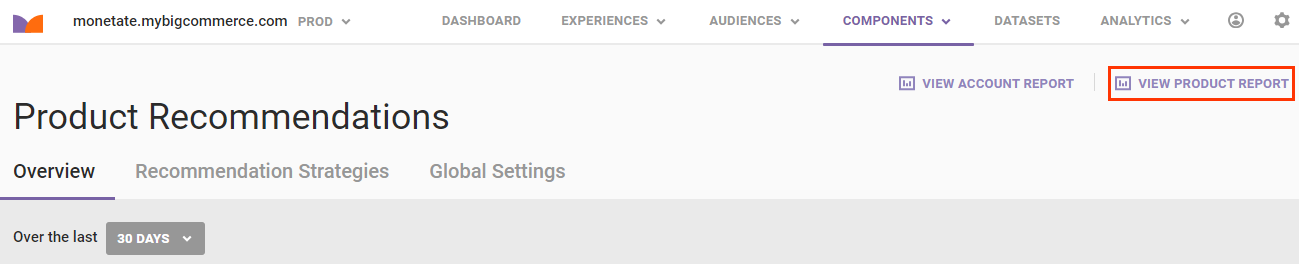
In addition to accessing this report from ANALYTICS > Global Recommendations Reports, you can view it by clicking VIEW ACCOUNT REPORT on the Product Recommendations page.
All Recommendations Experiences Report
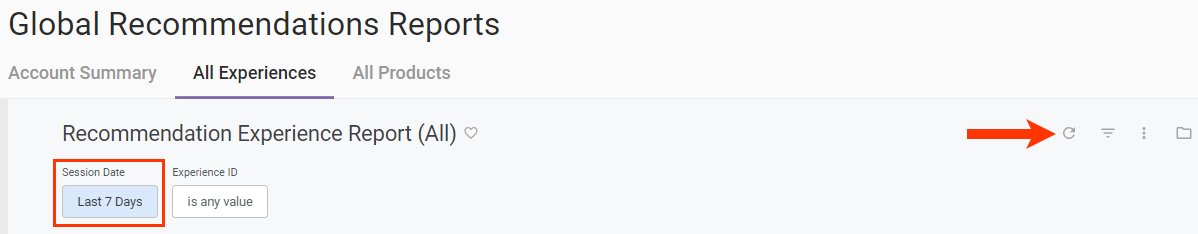
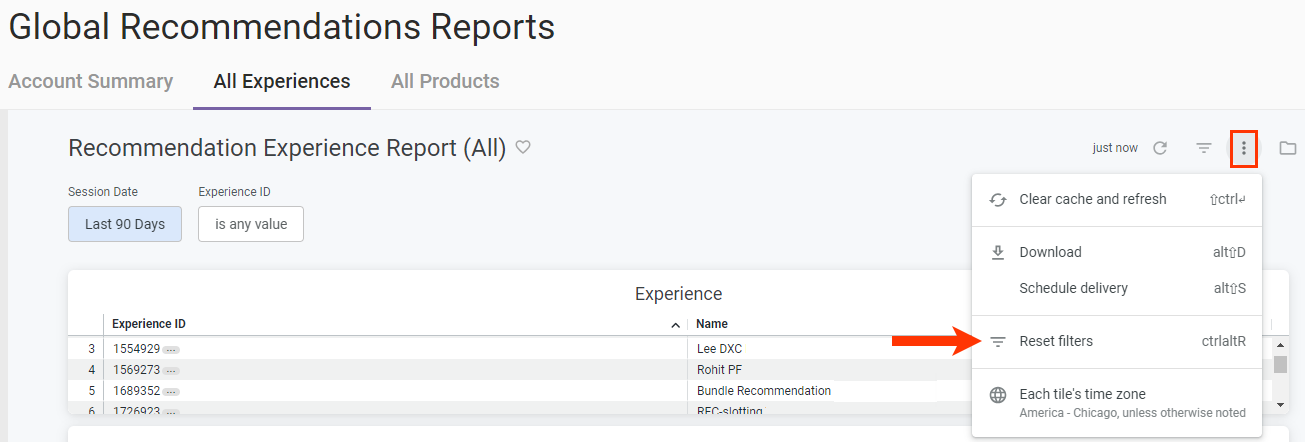
Click the All Experiences tab to view the Recommendation Experience Report (All).
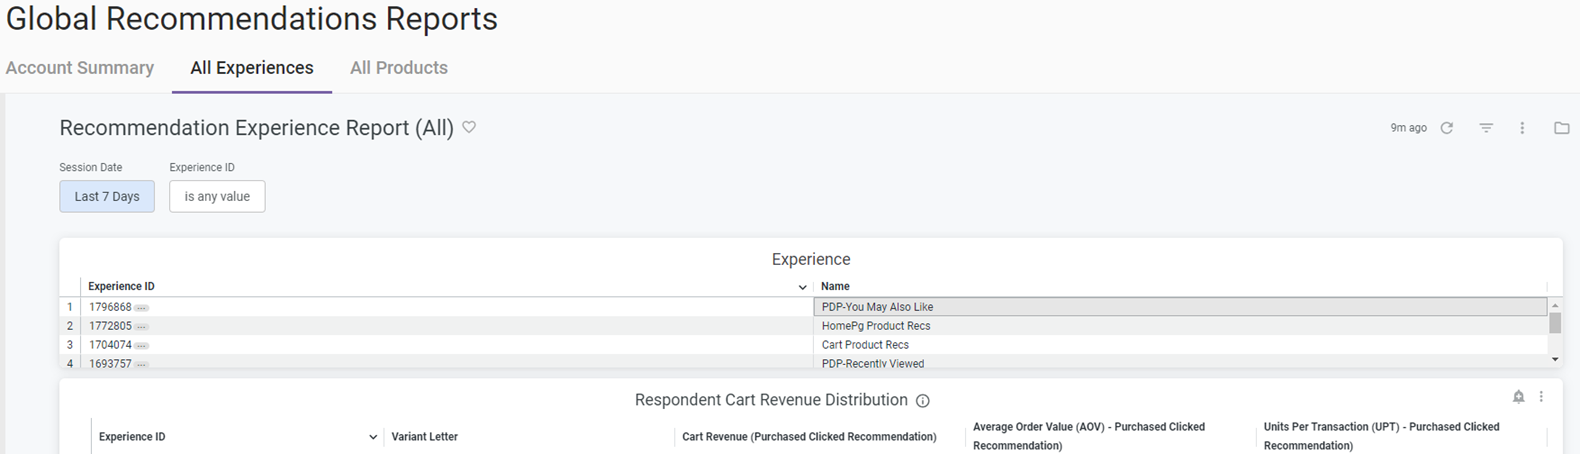
Its charts and graphs capture various performance metrics for all active recommendations experiences in the account for the last 7 days. You can change the lookback period by selecting an option from Session Date and then clicking the refresh icon.
You can also narrow the scope of the report by clicking Experience ID and then selecting one or more IDs.
Product Report
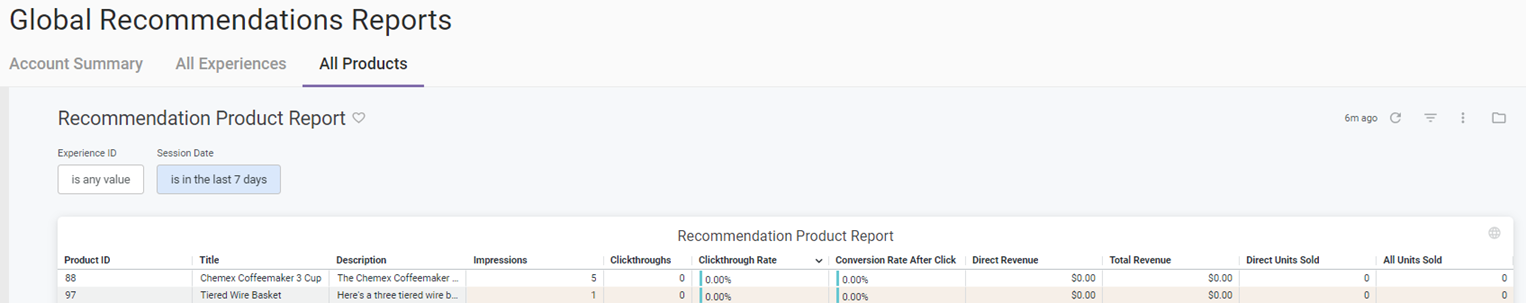
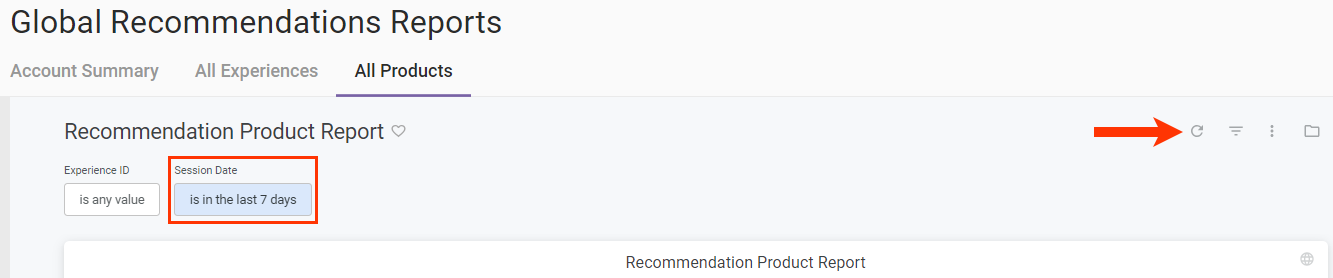
Click the All Products tab to view the Recommendation Product Report. It contains information about all the products sold either directly or indirectly through recommendations for the account.
You can change the lookback period by selecting an option from Session Date and then clicking the refresh icon.
In addition to accessing this report from ANALYTICS > Global Recommendations Reports, you can view it by clicking VIEW PRODUCT REPORT on the Product Recommendations page.
While you can view an experience-specific version of this report by selecting its ID from Experience ID, you can better access it from the experience's Experience Results page. See Product Report in the Experience-Level Reports section of this documentation for more information.
Experience-Level Reports
Four reports about different aspects of a specific recommendations experience are available so that you can better understand how that experience is performing.
Follow these steps to access one of these reports.
- Click ANALYTICS in the top navigation bar, and then select Experience Results.
- Search for the recommendations experience's entry on the Experience Analytics list page.
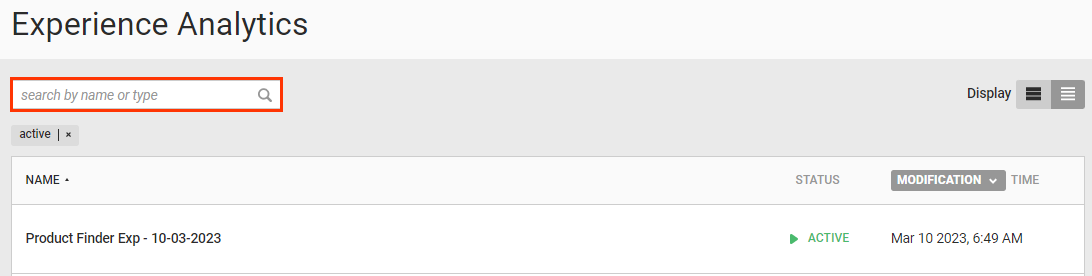
- Click the experience's name.
- Place your mouse pointer on the Recommendations tab, and then select one of the reports from the menu.
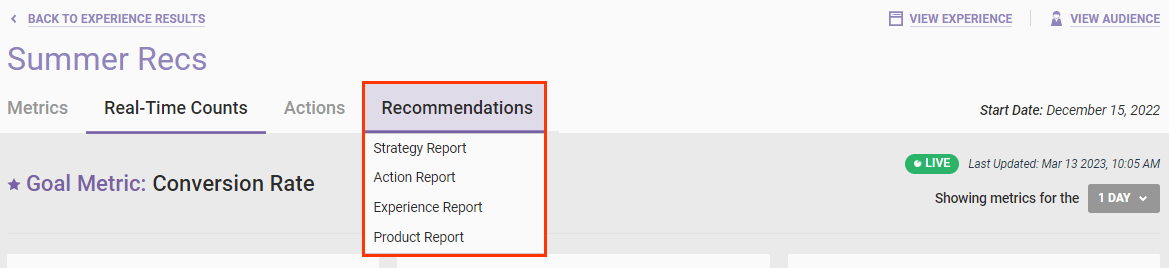
The report that you select opens in a new browser tab.
Strategy Report
The Recommendation Strategy Report contains various charts and tables that indicate how the recommendation strategy or strategies selected for the experience's recommendations action has performed over the past 7 days. If the experience has multiple recommendations actions, then each one is listed along with its selected recommendation strategy.
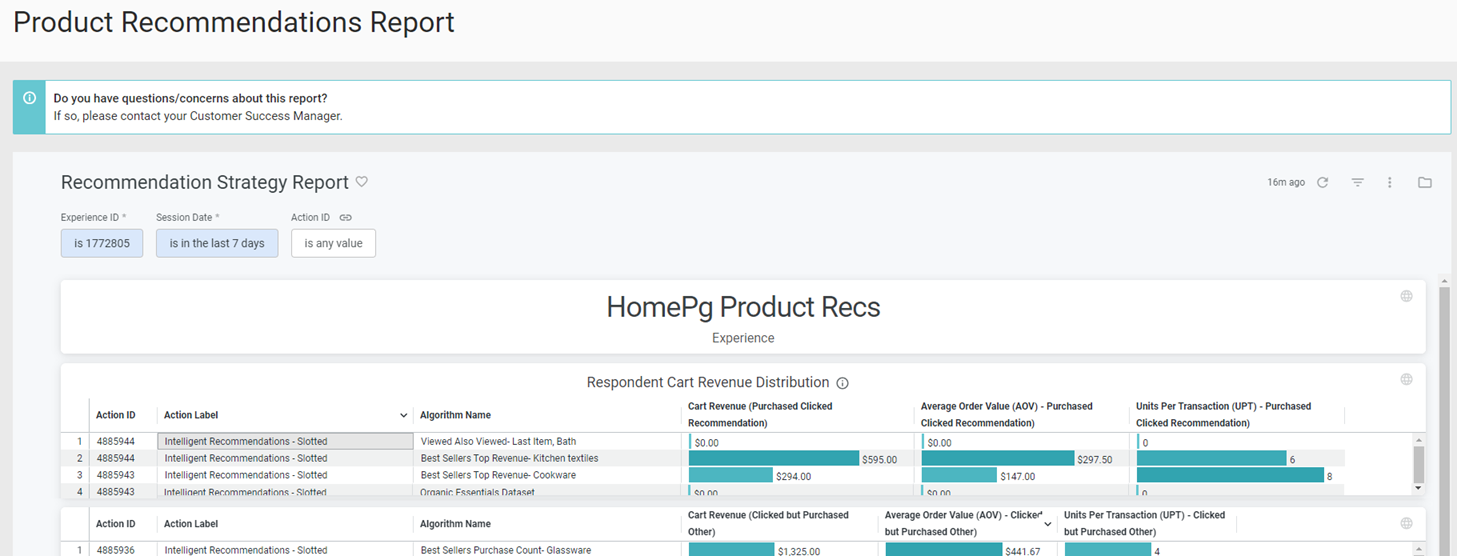
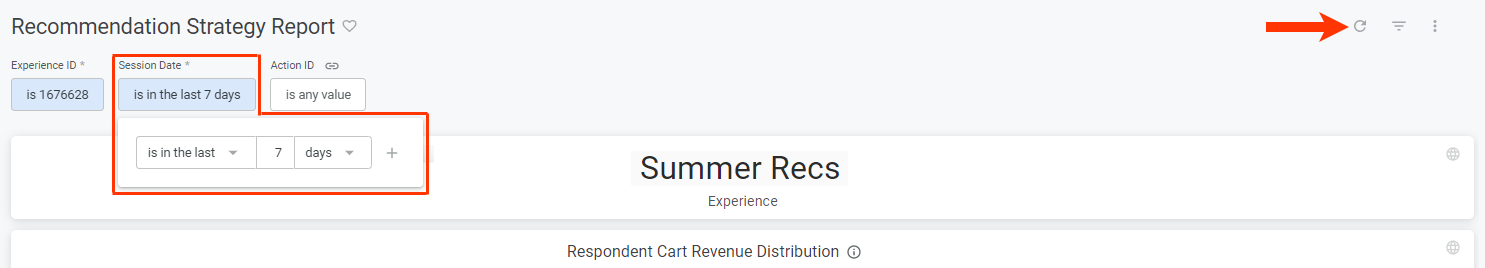
You can adjust the report's lookback period by selecting and configuring as necessary an option from Session Date. After you revise the filter, click the refresh icon.
Action Report
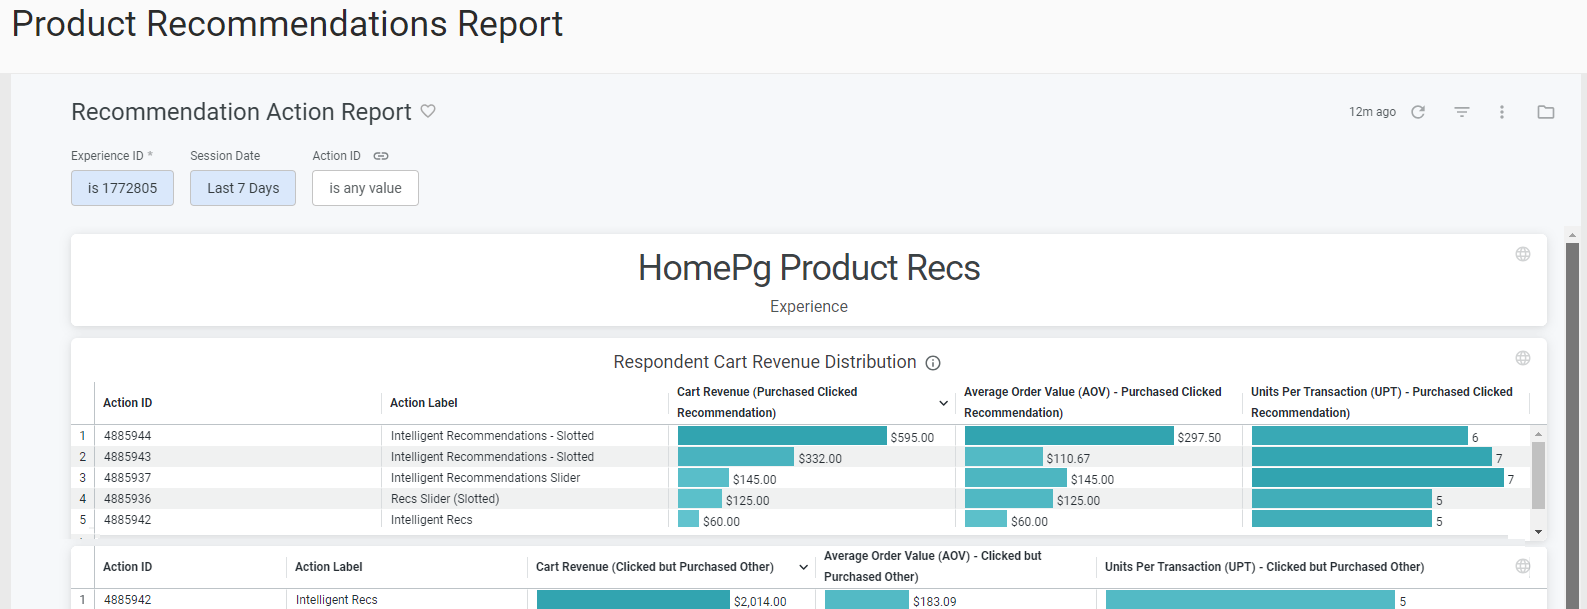
The charts and graphs in the Recommendation Action Report help you understand how each recommendations action in a recommendations experience has performed over the last 7 days. Like the Recommendation Strategy Report, the Recommendation Action Report lists each recommendations action if the experience has multiple actions. However, the Recommendation Action Report doesn't include the recommendation strategy selected for each recommendations action in the experience.
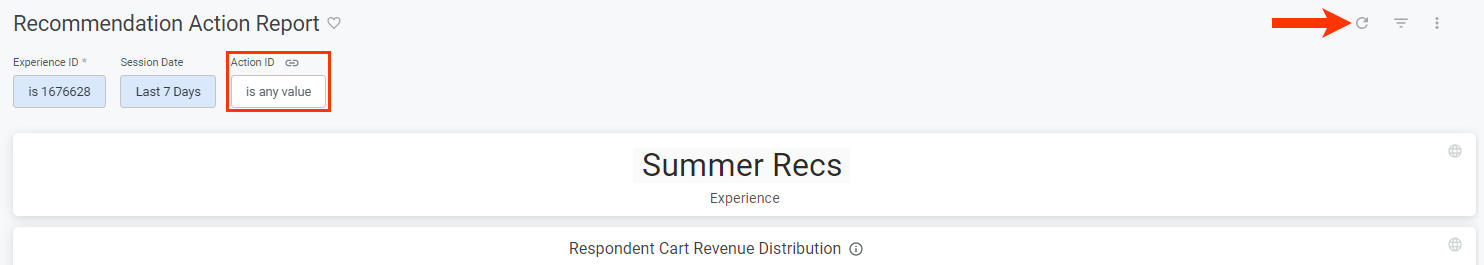
You can adjust the report's lookback period by selecting and configuring as necessary an option from Session Date. You can also filter which actions appear in the report by selecting options from Action ID. If you adjust any filter, ensure that you click the refresh icon.
Experience Report
This report contains various charts and tables that indicate how an experience is performing, specifically focusing on how each variant is performing.
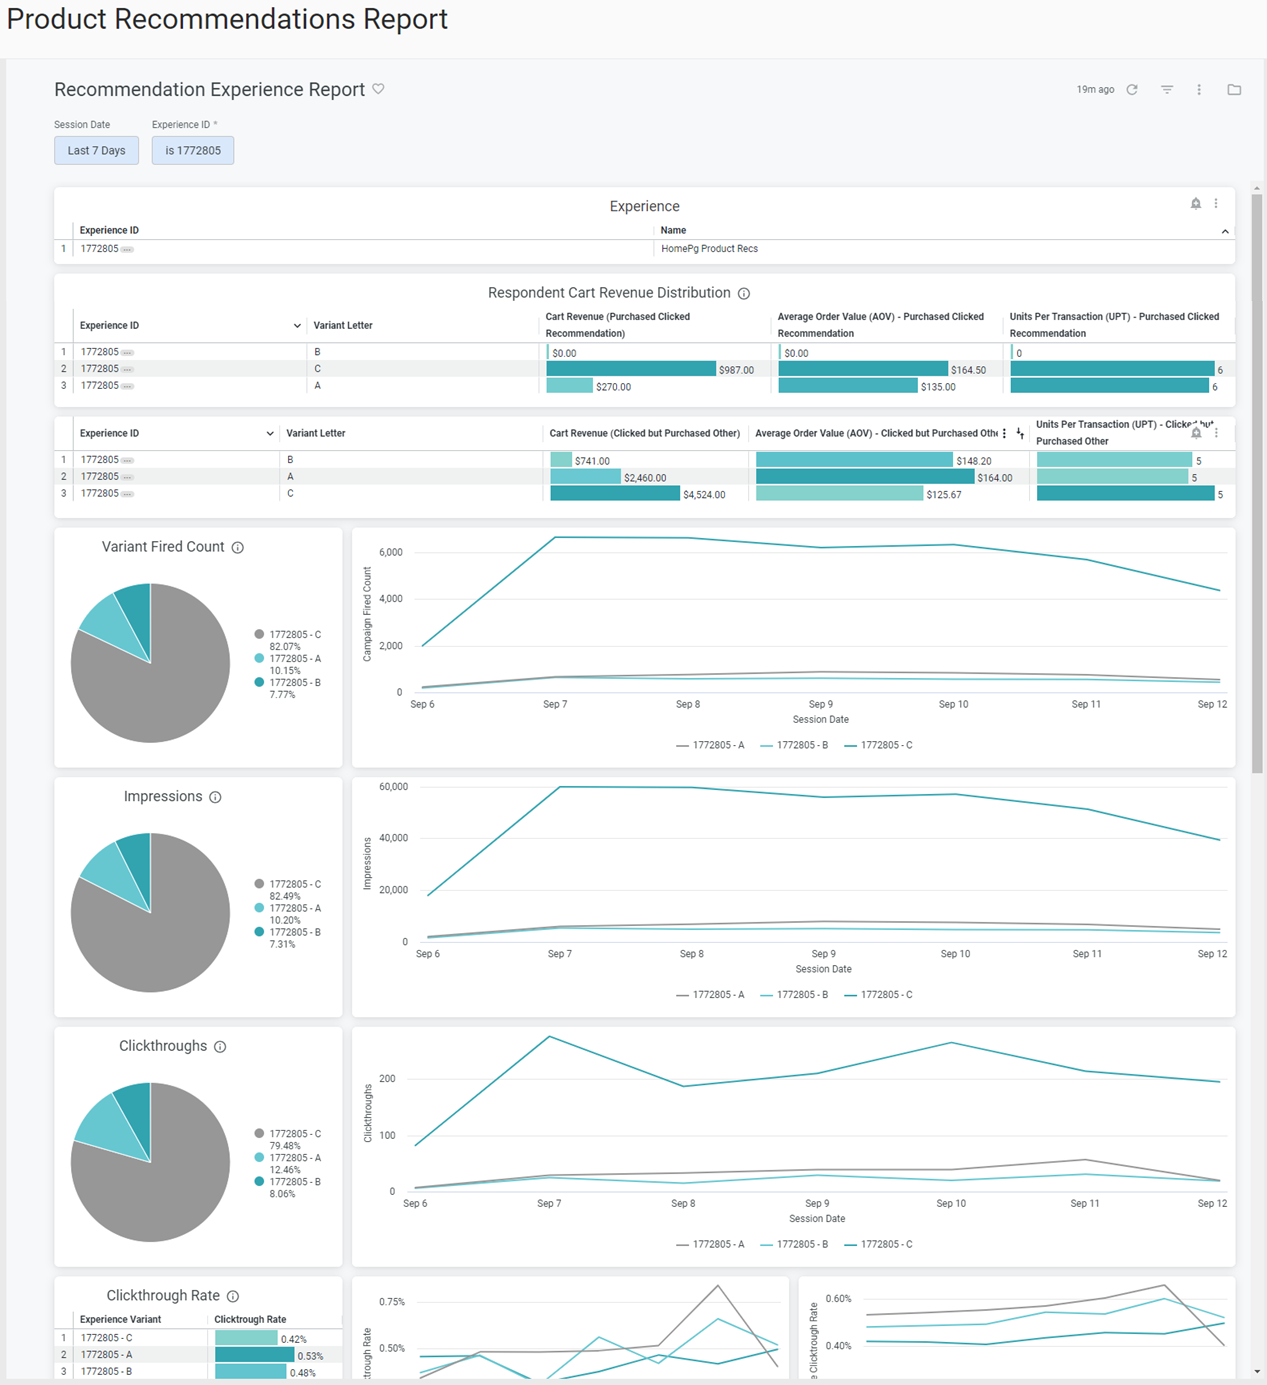
You can adjust the report's lookback period by selecting and configuring as necessary an option from Session Date and then clicking the refresh icon.
Product Report
Select Product Report to view a single table of all products directly and indirectly sold due to recommendations.
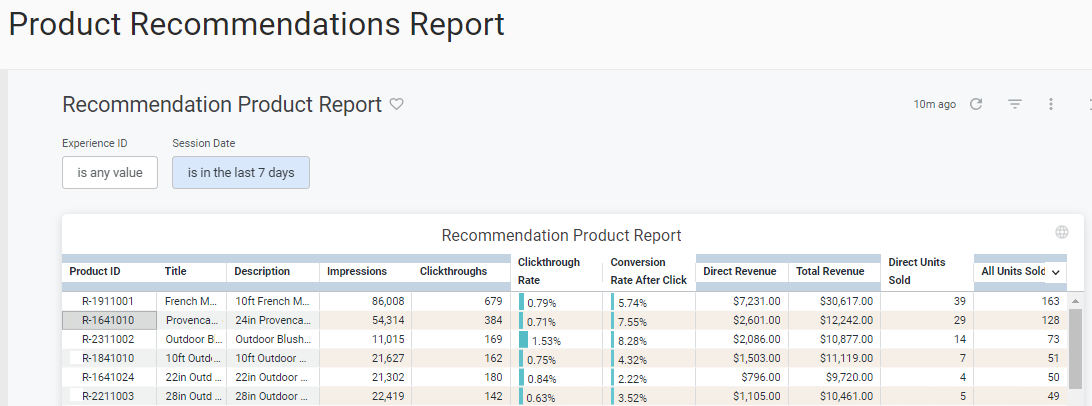
To adjust the report's lookback period, select and configure as necessary an option from Session Date, and then click the refresh icon.
Using Filters
The default filters applied to a report appear below the report title. Click the filters icon to hide or show the filters.
To adjust a filter, click it and then select an option. After you revise the filter(s), click the refresh icon.
To restore a report's filters to their defaults, click the additional options menu (⋮), and then select Reset filters.
You cannot remove a filter from nor add additional ones to any report.
Downloading Reports
You can download a report as a PDF or CSV file. First, click the additional options menu (⋮), select Download, and then select the file format. If you select PDF, you can select the paper size and choose certain other format options.
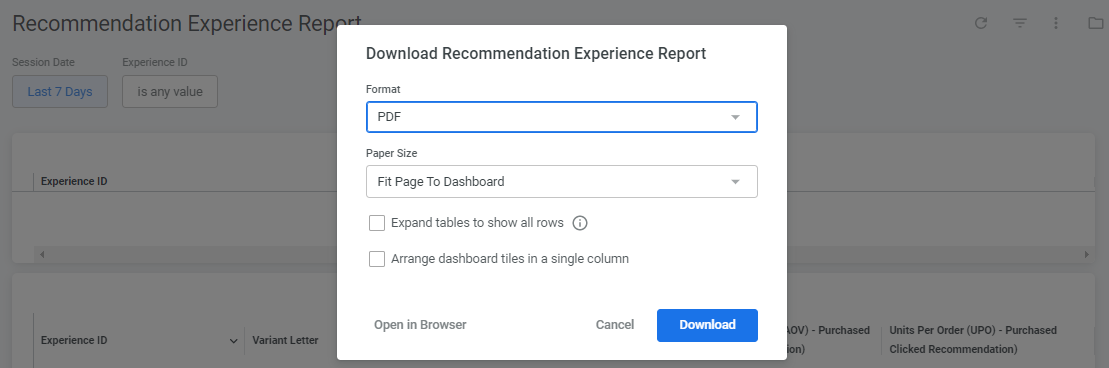
Click Download to generate the report, and then choose a location to save it.
Scheduling Report Deliveries
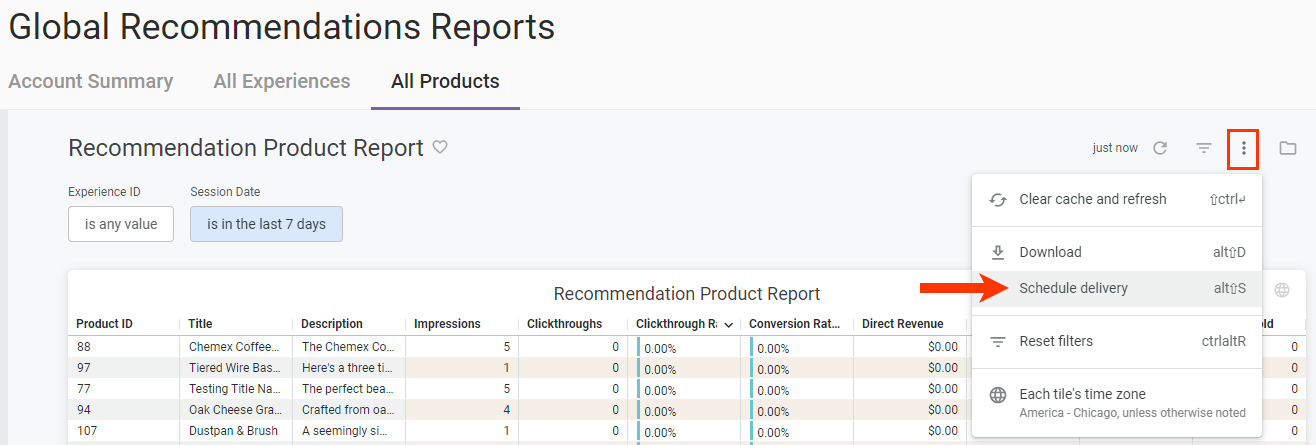
You can automatically generate and share a report on a schedule that you establish in Monetate. First, click the additional options menu (⋮), and then select Schedule delivery.
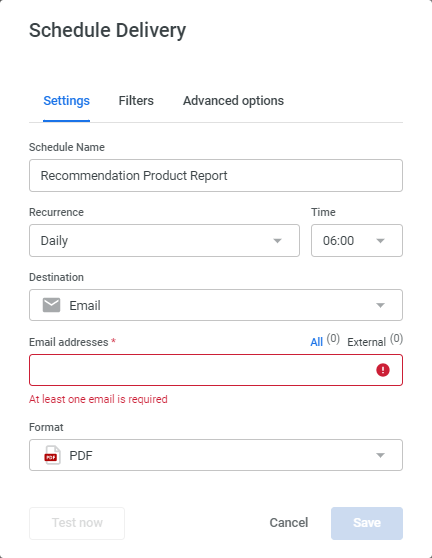
On the Settings tab of the Schedule Delivery modal, select how frequently you want the report generated and the timing associated with that choice. Choose an option from Destination to determine how you want to share the report (for example, by email to specific recipients, to a specific cloud location, via SFTP to a private directory). Finally, select the report format: PDF, CSV file, or image.
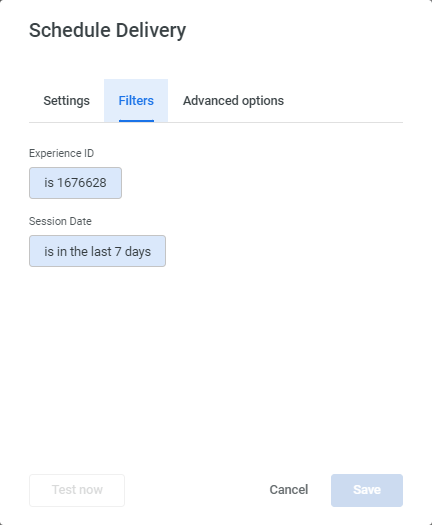
Optionally, click the Filters tab to adjust as necessary the filters that are available for the report that you're scheduling.
The settings that appear on the Advanced options tab are determined by the option you selected from Destination and from Format on the Settings tab. The options on the Advanced options tab allow you to customize the layout, appearance, or formatting of the report data in the file generated. The one option that always appears on the Advanced options tab is Delivery timezone.
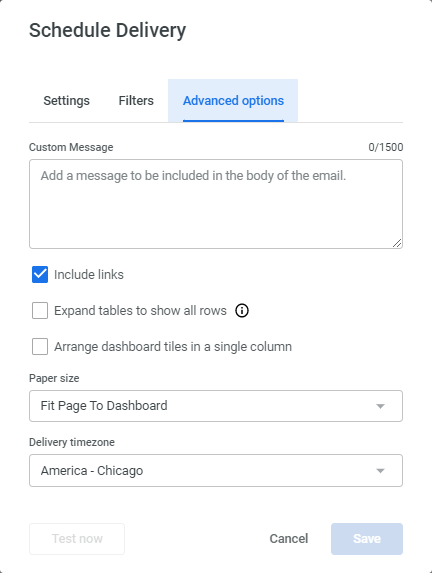
The screenshot above shows the options available on the Advanced options tab for a weekly PDF report sent via email.
After you configure the schedule and report formatting options, click Save to close the Schedule Delivery modal.