The Personalized Site Search dashboard displays overall search analytics.

You can change the date range for the analytics data by selecting one of the options that appears. The default view is 30 days' worth of data. You can view up to the previous 365 days' worth of analytics data.
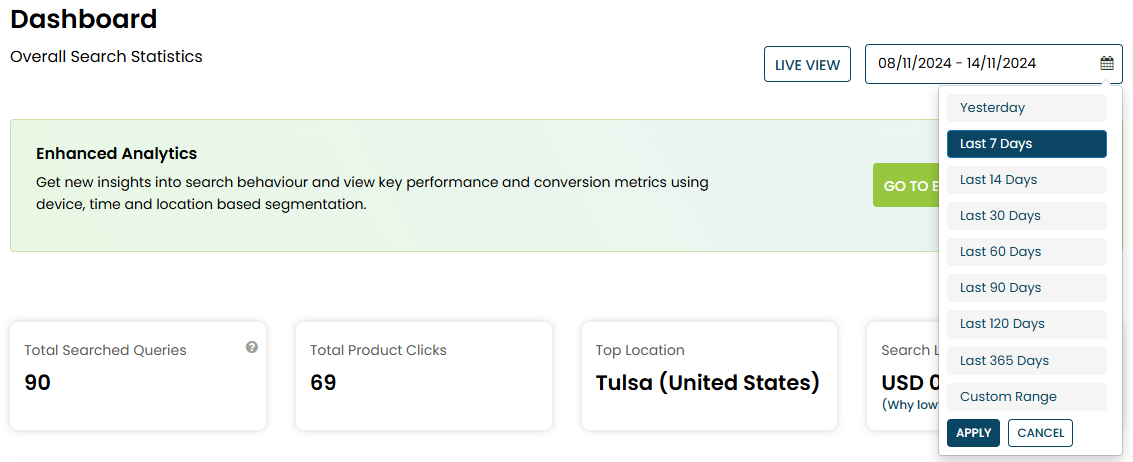
You can also set a custom date range.
Data from the selected date range is displayed for these metrics:
- Total Searched Queries: The number of search queries customers executed within the selected date range.
- Total Product Clicks: The number of clicks on products resulting from search.
- Top Location: The city and country where the most searches originated.
- Search Led Sales: The total sales generated through search.
You can access additional data by clicking one of the tabs on the dashboard.
Keywords
The Keywords tab displays the most frequently submitted search terms within the selected date range.

Click Keywords with 0 results to view a table of search terms that customers used that received zero results, along with the number of times each listed search term was used.
Clicks
On the Clicks tab, you can view the most frequently clicked products within the selected date range.

The Most frequently clicked products table also includes how many times each product was clicked from search results, as well as the search terms that customers used to find each product and the number of times each search term was used.
Locations
Click the Locations tab to view the city and country where customers are using your site search along with a list of their search terms.
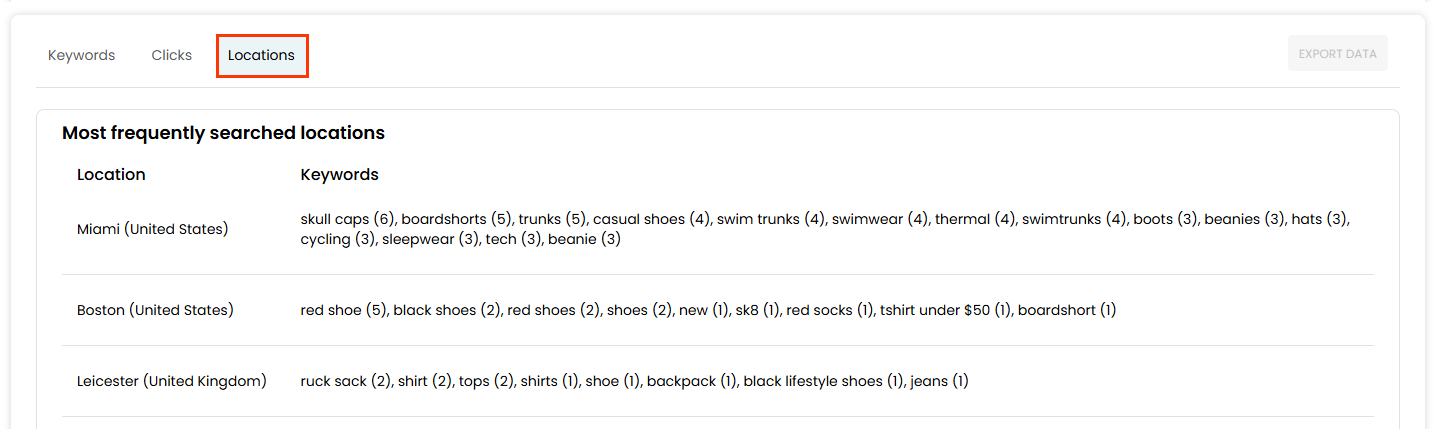
The Most frequently searched locations table displays the number of times a specific search term was used in parentheses next to each one listed.
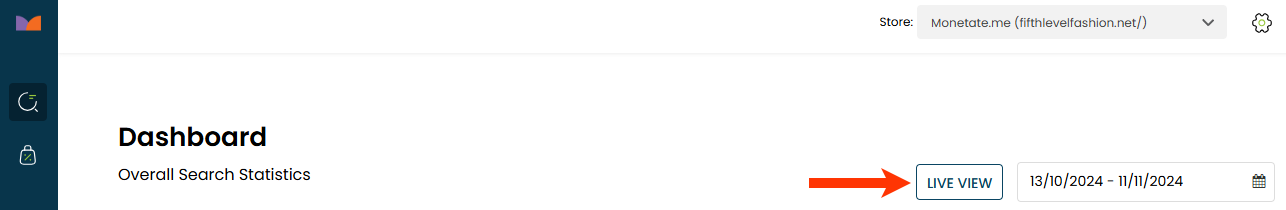
Live View
Click LIVE VIEW on the dashboard to see real-time information about search activity.
The heat map shows where search traffic from the last 1 minute is occurring. Use the controls to zoom in or out on the map. The Live Searches table displays a rolling list of up to 25 search terms that customers are using on your site.
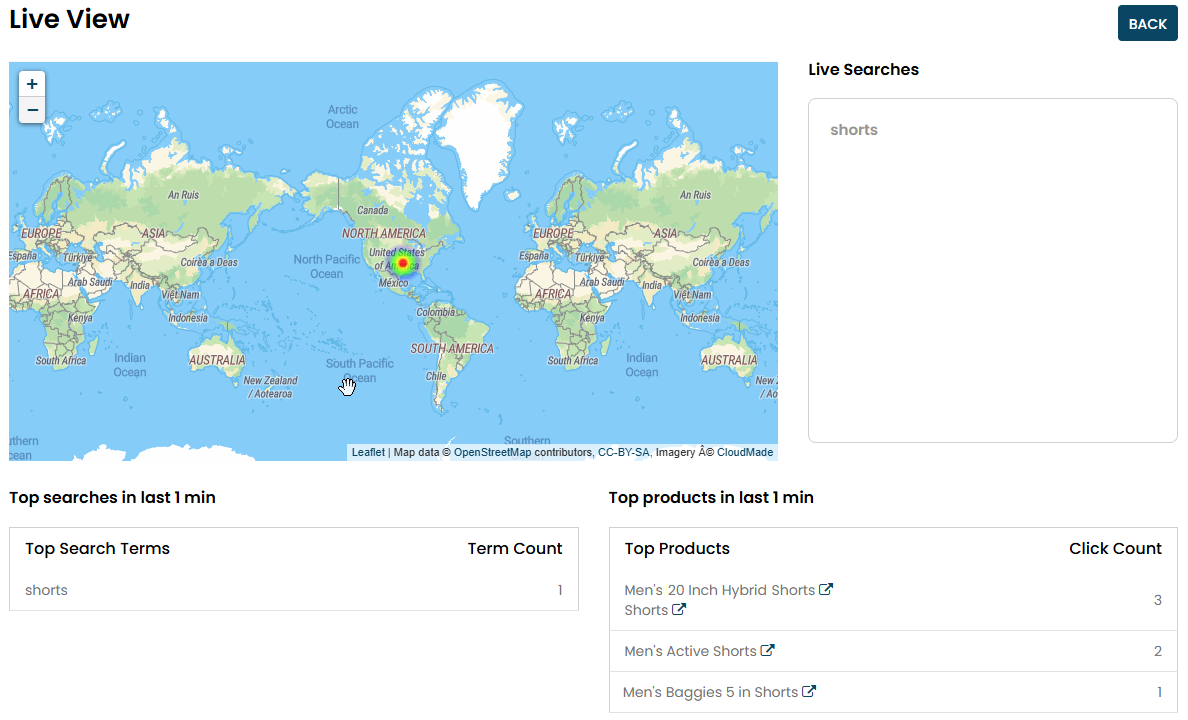
The tables under the map display a rolling list of the 10 most frequently search terms and clicked products, respectively, along with the total times customers used each reported search term and clicked each reported product, respectively.
If no search activity is taking place on your site, then all three tables are empty. Because the metrics refreshes every 10 seconds, the results reported eventually roll off.
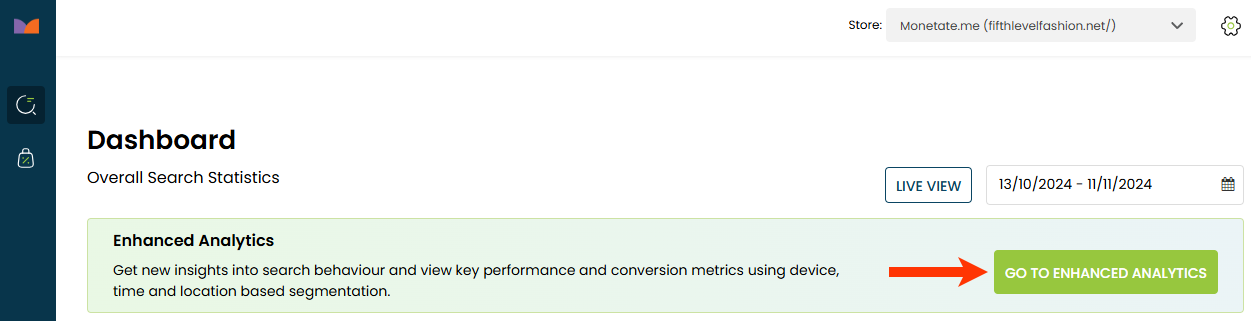
Enhanced Analytics
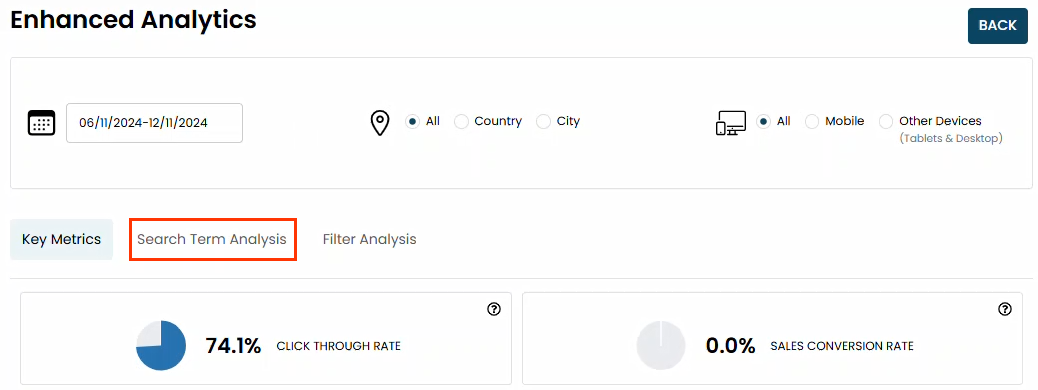
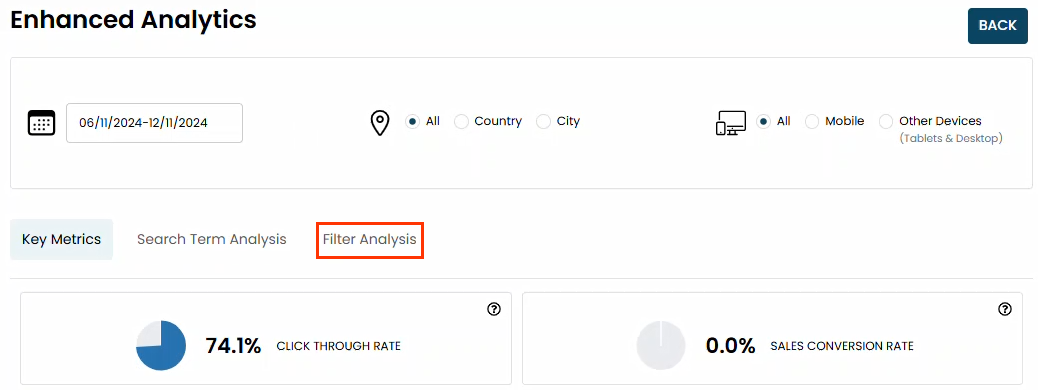
Click GO TO ENHANCED ANALYTICS on the dashboard to view more detailed search analytics data.
Like on the main dashboard, you can select a date range for the data displayed. You can also filter the search-related data by country or by city as well as by device type.
The Enhanced Analytics page includes three tabs that each display a specific report.
Key Metrics
The Key Metrics tab displays graph breakdowns of search queries, search users, and other metrics for Personalized Search experiences.

The Search Queries panel consists of the following analytics:
- Click Through Rate: The percentage of searches that result in a product click. A high rate indicates that searches are providing customers with exactly what they're looking for.
- Sales Conversion Rate: The percentage of a storefront's sales resulting from a search.
- Search Queries: A graphical representation of search queries over time.
- Total Search Queries: The total full-term search queries executed. This number consists of full queries, not auto-suggest results.
- Average Queries per Search User: The average number of full-term search queries executed per customer.
The Search Users panel appears below the Search Queries panel.
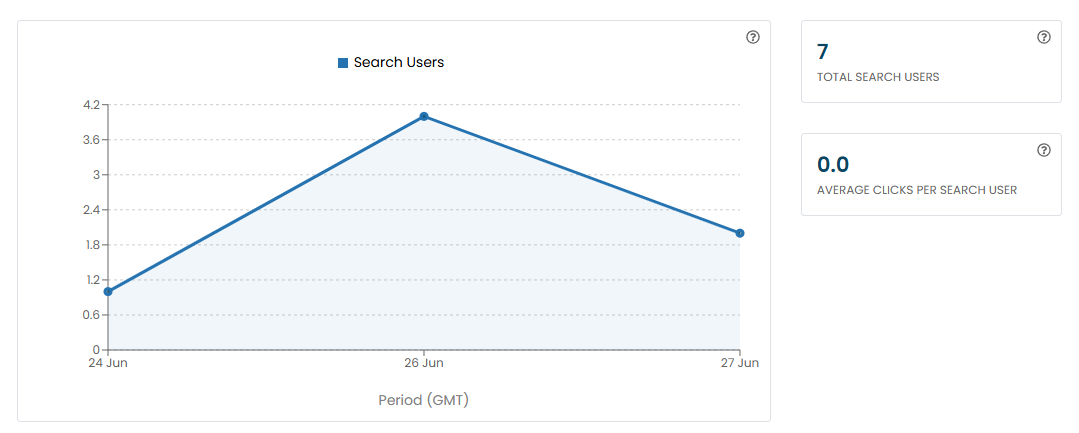
This panel consists of the following analytics:
- Search Users: A graphical representation of search users over time.
- Total Search Users: The total number of customers who used personalized search.
- Average Clicks per Search User: The average number of product clicks per search user. A high number indicates more active engagement with the storefront.
The Sales panel appears at the bottom of the Key Metrics tab.
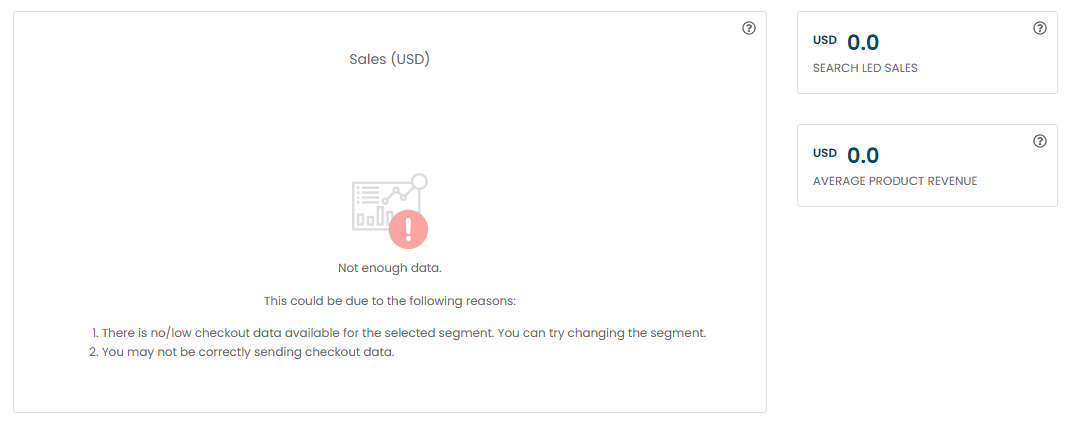
This panel consists of the following analytics:
- Sales: A graphical representation of sales over time.
- Search Led Sales: The total sales generated through search.
- Average Product Revenue: The total sales generated by search divided by the quantity of products that made up those sales. It indicates the average product value of products purchased through search.
Search Term Analysis
Click the Search Term Analysis tab to view analytics about individual search terms that customers used.
The word graph visually represents how customers use certain terms together. The strength of the relationship between terms is indicated by the thickness of the connecting line.
In the example graph shown in this animated demonstration, the search term t is often associated with the search term shirt in queries. Seeing these associations can help you understand the trend, behavior, and psyche of your customers.
You can add additional terms to the graph by selecting them from the listed top terms or by typing them into the text box. Terms added to the graph are outlined in dark blue.
In the upper-right corner of the graph are controls to zoom in or out on the graph as well as to download the graph as a PNG file.
Below the word graph you find the Top 10 Full Term Searches table and the Search Term Usage by Device chart.
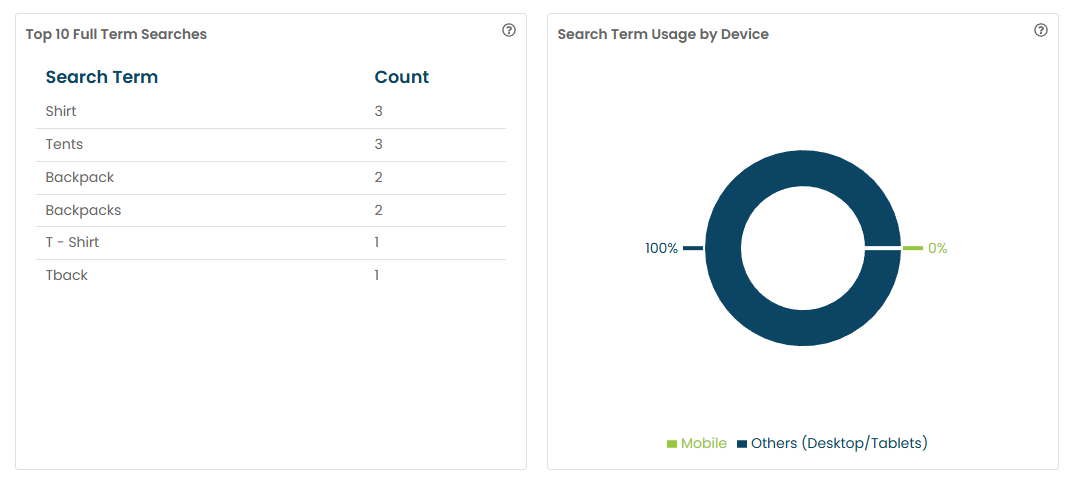
The Top 10 Full Term Searches table contains a list of the 10 most frequently searched terms, as well as the total search count for each term. The Search Term Usage by Device chart displays the percentage of search queries performed on mobile devices and on desktop computers and tablets.
Filter Analysis
Click the Filter Analysis tab to view analytics about filters that customers used.
At the top of the tab are the Most Popular Filters table and the Distribution of Filter Clicks chart.
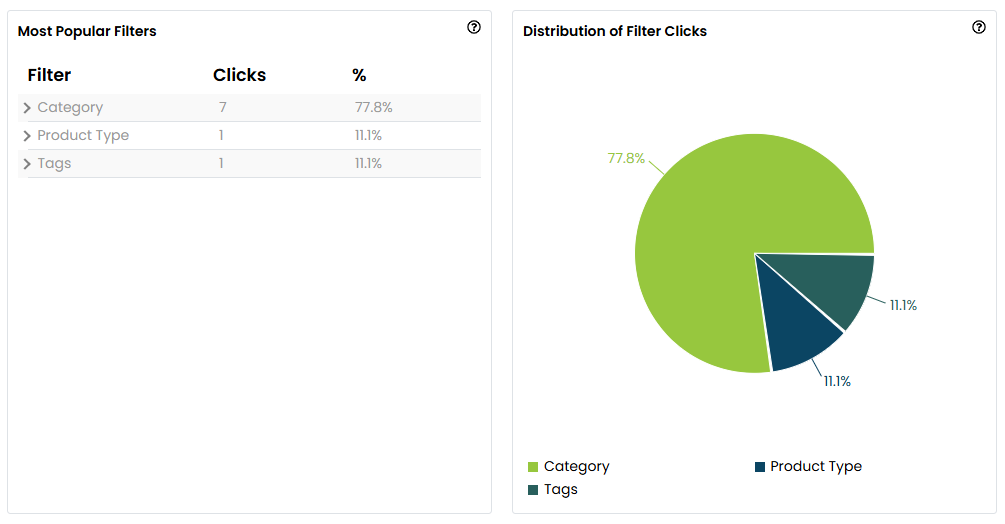
The table contains the 10 most-used filters in three segments—Category, Product Type, and Tags—that customers applied to their searches. You can expand each segment to reveal the top five filters within that segment that customers used.
The Distribution of Filter Clicks pie chart to the right of the table represents how frequently customers filter options from each of the three segments.
Below the Most Popular Filters table is the Most Popular Filter-Values table along with a statement of the percentage of customers who used filters in their searches. The Most Popular Filters table contains the 10 most popular pairs of filters and values. It also includes a percentage makeup of all filter usage and the number of times this filter-value pair was applied.

In the bottom-right corner of the Filter Analysis tab is the Usage By Device pie chart, which displays the percentage of customers who applied filters when shopping on mobile devices and on desktops and tablets.